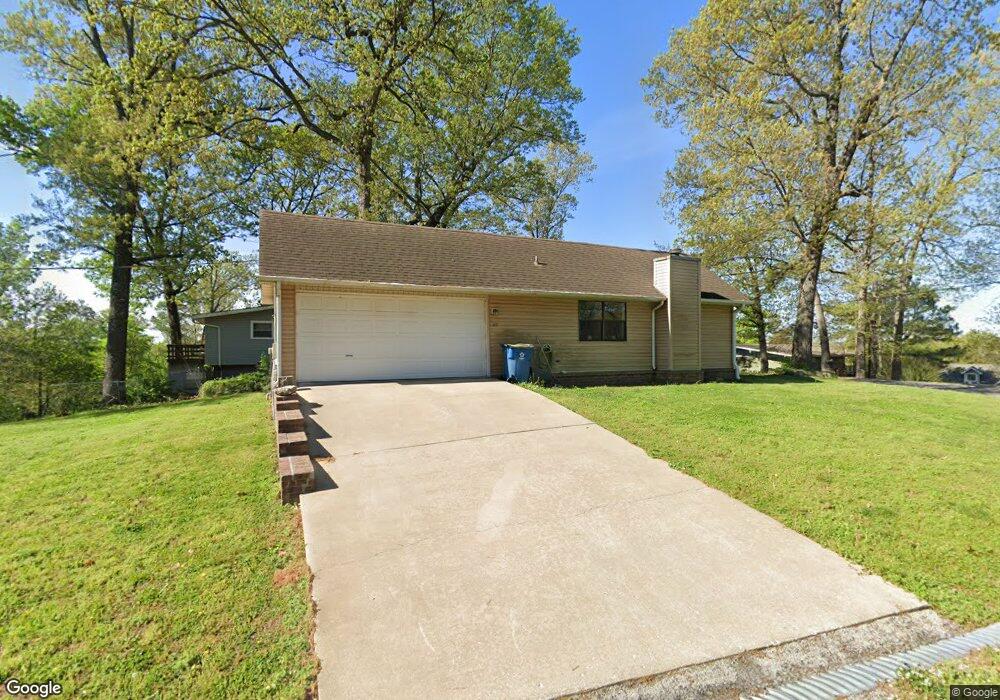
39 Basore Dr Bella Vista, AR 72715
Estimated Value: $237,000 - $259,000
2
Beds
2
Baths
1,176
Sq Ft
$211/Sq Ft
Est. Value
About This Home
This home is located at 39 Basore Dr, Bella Vista, AR 72715 and is currently estimated at $248,022, approximately $210 per square foot. 39 Basore Dr is a home located in Benton County with nearby schools including Cooper Elementary School, Old High Middle School, and Washington Junior High School.
Ownership History
Date
Name
Owned For
Owner Type
Purchase Details
Closed on
Feb 27, 2004
Bought by
Chandler
Current Estimated Value
Purchase Details
Closed on
Jun 29, 2000
Bought by
Booth
Purchase Details
Closed on
May 28, 1996
Bought by
Christman
Purchase Details
Closed on
Jan 16, 1996
Bought by
Moody
Purchase Details
Closed on
Jun 22, 1995
Bought by
Craig
Purchase Details
Closed on
Feb 13, 1995
Bought by
Adams and Adams Adams
Purchase Details
Closed on
Jul 7, 1994
Bought by
Adams
Purchase Details
Closed on
Nov 21, 1989
Bought by
Bvpoa
Purchase Details
Closed on
Jan 9, 1976
Bought by
Stufflebean
Create a Home Valuation Report for This Property
The Home Valuation Report is an in-depth analysis detailing your home's value as well as a comparison with similar homes in the area
Home Values in the Area
Average Home Value in this Area
Purchase History
| Date | Buyer | Sale Price | Title Company |
|---|---|---|---|
| Chandler | $85,000 | -- | |
| Chandler | $85,000 | -- | |
| Booth | $72,000 | -- | |
| Christman | $73,000 | -- | |
| Moody | $45,000 | -- | |
| Craig | $2,000 | -- | |
| Adams | -- | -- | |
| Adams | $1,000 | -- | |
| Bvpoa | $4,000 | -- | |
| Elem | -- | -- | |
| Stufflebean | $4,000 | -- |
Source: Public Records
Tax History
| Year | Tax Paid | Tax Assessment Tax Assessment Total Assessment is a certain percentage of the fair market value that is determined by local assessors to be the total taxable value of land and additions on the property. | Land | Improvement |
|---|---|---|---|---|
| 2025 | $1,214 | $41,044 | $1,600 | $39,444 |
| 2024 | $1,202 | $41,044 | $1,600 | $39,444 |
| 2023 | $1,202 | $26,820 | $800 | $26,020 |
| 2022 | $925 | $26,820 | $800 | $26,020 |
| 2021 | $863 | $26,820 | $800 | $26,020 |
| 2020 | $815 | $18,680 | $600 | $18,080 |
| 2019 | $815 | $18,680 | $600 | $18,080 |
| 2018 | $840 | $18,680 | $600 | $18,080 |
| 2017 | $791 | $18,680 | $600 | $18,080 |
| 2016 | $791 | $18,680 | $600 | $18,080 |
| 2015 | $1,061 | $17,600 | $1,000 | $16,600 |
| 2014 | $711 | $17,600 | $1,000 | $16,600 |
Source: Public Records
Map
Nearby Homes
Your Personal Tour Guide
Ask me questions while you tour the home.