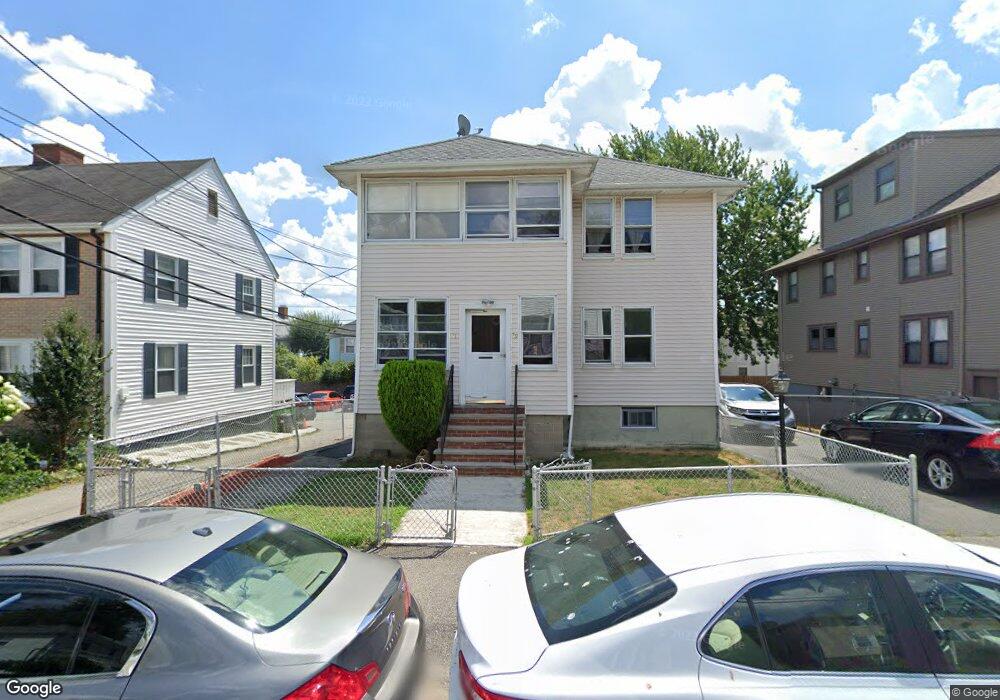
39 Bay State Rd Quincy, MA 02171
Marina Bay NeighborhoodEstimated Value: $834,236 - $981,000
4
Beds
2
Baths
2,240
Sq Ft
$409/Sq Ft
Est. Value
About This Home
This home is located at 39 Bay State Rd, Quincy, MA 02171 and is currently estimated at $916,809, approximately $409 per square foot. 39 Bay State Rd is a home located in Norfolk County with nearby schools including Squantum Elementary School, Atlantic Middle School, and North Quincy High School.
Ownership History
Date
Name
Owned For
Owner Type
Purchase Details
Closed on
Jun 21, 2007
Sold by
Chan Sui C and Chan Mark Sui
Bought by
Mark Chuck F and Mark Lai F
Current Estimated Value
Create a Home Valuation Report for This Property
The Home Valuation Report is an in-depth analysis detailing your home's value as well as a comparison with similar homes in the area
Home Values in the Area
Average Home Value in this Area
Purchase History
| Date | Buyer | Sale Price | Title Company |
|---|---|---|---|
| Mark Chuck F | -- | -- |
Source: Public Records
Tax History
| Year | Tax Paid | Tax Assessment Tax Assessment Total Assessment is a certain percentage of the fair market value that is determined by local assessors to be the total taxable value of land and additions on the property. | Land | Improvement |
|---|---|---|---|---|
| 2025 | $9,106 | $789,800 | $330,600 | $459,200 |
| 2024 | $8,538 | $757,600 | $312,300 | $445,300 |
| 2023 | $7,955 | $714,700 | $283,900 | $430,800 |
| 2022 | $7,549 | $630,100 | $227,100 | $403,000 |
| 2021 | $7,683 | $632,900 | $227,100 | $405,800 |
| 2020 | $7,318 | $588,700 | $209,600 | $379,100 |
| 2019 | $7,027 | $559,900 | $201,600 | $358,300 |
| 2018 | $6,815 | $510,900 | $203,900 | $307,000 |
| 2017 | $6,746 | $476,100 | $185,400 | $290,700 |
| 2016 | $6,178 | $430,200 | $176,500 | $253,700 |
| 2015 | $5,933 | $406,400 | $165,800 | $240,600 |
| 2014 | $5,220 | $351,300 | $162,200 | $189,100 |
Source: Public Records
Map
Nearby Homes
- 212 Quincy Shore Dr
- 175 Quincy Shore Dr Unit B24
- 175 Quincy Shore Dr Unit B23
- 138 Quincy Shore Dr Unit 170
- 90 Quincy Shore Dr Unit 721
- 90 Quincy Shore Dr Unit 501
- 201 Billings St
- 133 Commander Shea Blvd Unit 502
- 133 Commander Shea Blvd Unit 709
- 297 Billings St
- 85 E Squantum St Unit 10
- 100 Marina Dr Unit 615
- 100 Marina Dr Unit 306
- 171 Walnut St Unit 4
- 10 Seaport Dr Unit 2505
- 10 Seaport Dr Unit 2213
- 70 Walnut St
- 28 Port Norfolk St
- 27 Herbert Rd
- 19 Harbourside Rd Unit 19
- 43 Bay State Rd
- 35 Bay State Rd
- 35 Bay State Rd Unit 35
- 35 Bay State Rd Unit 2
- 43 Bay State Rd
- 37 Bay State Rd Unit 37
- 37 Bay State Rd Unit 2
- 45 Bay State Rd
- 212A Quincy Shore Dr
- 47 Bay State Rd
- 216A Quincy Shore Dr
- 208A Quincy Shore Dr
- 33 Bay State Rd
- 33 Bay State Rd Unit A
- 33 Bay State Rd Unit 33
- 16 Bay State Rd
- 49 Bay State Rd
- 216 Quincy Shore Dr
- 208 Quincy Shore Dr
- 220B Quincy Shore Dr
Your Personal Tour Guide
Ask me questions while you tour the home.