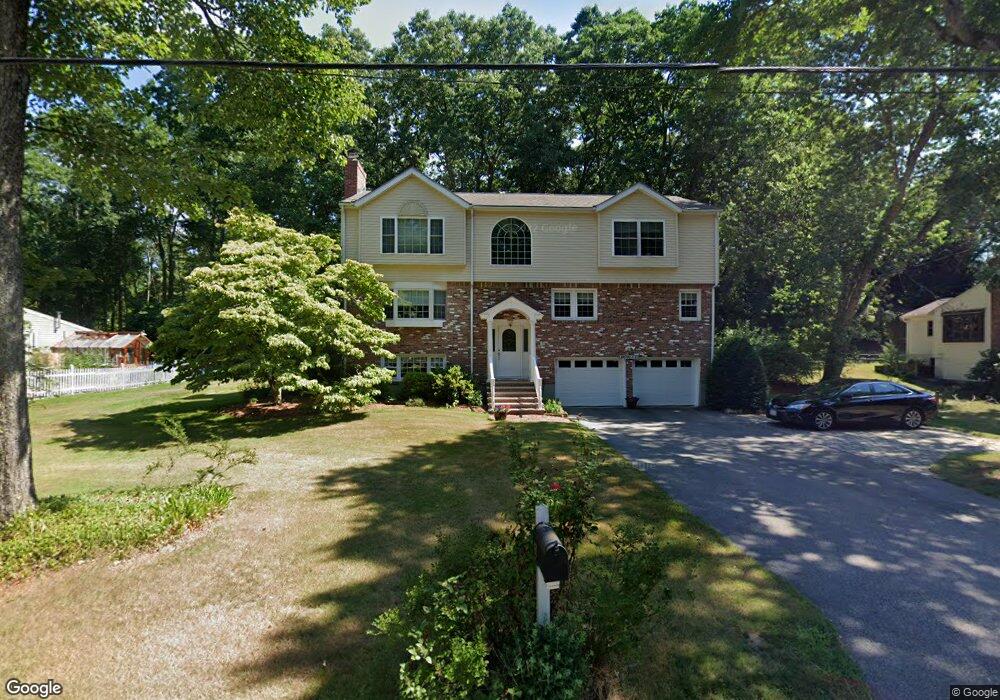
39 Bayberry Ln Holliston, MA 01746
Estimated Value: $853,824 - $965,000
3
Beds
3
Baths
2,664
Sq Ft
$338/Sq Ft
Est. Value
About This Home
This home is located at 39 Bayberry Ln, Holliston, MA 01746 and is currently estimated at $899,456, approximately $337 per square foot. 39 Bayberry Ln is a home located in Middlesex County with nearby schools including Miller Elementary School, Robert H. Adams Middle School, and Holliston High School.
Ownership History
Date
Name
Owned For
Owner Type
Purchase Details
Closed on
Apr 17, 2003
Sold by
Casale Loredana and Williams Loredana C
Bought by
Williams Loredana C and Williams Michael T
Current Estimated Value
Home Financials for this Owner
Home Financials are based on the most recent Mortgage that was taken out on this home.
Original Mortgage
$50,000
Interest Rate
5.75%
Purchase Details
Closed on
Jun 15, 1992
Sold by
Gundy James H and Gundy Susan Z
Bought by
Williams Michael T and Casale Loredana
Create a Home Valuation Report for This Property
The Home Valuation Report is an in-depth analysis detailing your home's value as well as a comparison with similar homes in the area
Home Values in the Area
Average Home Value in this Area
Purchase History
| Date | Buyer | Sale Price | Title Company |
|---|---|---|---|
| Williams Loredana C | -- | -- | |
| Williams Michael T | $169,500 | -- |
Source: Public Records
Mortgage History
| Date | Status | Borrower | Loan Amount |
|---|---|---|---|
| Open | Williams Michael T | $236,500 | |
| Closed | Williams Loredana C | $50,000 | |
| Previous Owner | Williams Michael T | $17,000 |
Source: Public Records
Tax History Compared to Growth
Tax History
| Year | Tax Paid | Tax Assessment Tax Assessment Total Assessment is a certain percentage of the fair market value that is determined by local assessors to be the total taxable value of land and additions on the property. | Land | Improvement |
|---|---|---|---|---|
| 2025 | $11,502 | $785,100 | $268,400 | $516,700 |
| 2024 | $10,385 | $689,600 | $268,400 | $421,200 |
| 2023 | $10,415 | $676,300 | $268,400 | $407,900 |
| 2022 | $10,084 | $580,200 | $268,400 | $311,800 |
| 2021 | $9,960 | $558,000 | $246,200 | $311,800 |
| 2020 | $9,598 | $509,200 | $242,700 | $266,500 |
| 2019 | $8,940 | $474,800 | $211,100 | $263,700 |
| 2018 | $8,865 | $474,800 | $211,100 | $263,700 |
| 2017 | $8,512 | $459,600 | $203,100 | $256,500 |
| 2016 | $8,157 | $434,100 | $177,600 | $256,500 |
| 2015 | $8,099 | $417,900 | $158,900 | $259,000 |
Source: Public Records
Map
Nearby Homes
- 8 Raymond Way
- 97 Meeting House Path Unit 97
- 152 Turner Rd Unit 43
- 152 Turner Rd Unit 14
- 74 Meeting House Path
- 72 Meeting House Path
- 277 Meeting House Path
- 147 Turner Rd Unit 80
- 59 Turner Rd
- 157 Leland Farm Rd
- 120 Prospect St
- 150 Westfield Dr
- 63 Trailside Way Unit 63
- 95 Brooksmont Dr Unit 26
- 133 Brooksmont Dr Unit 43
- 67 Spyglass Hill Dr
- 306 Trailside Way
- 32 Colonial Way
- 84 E Bluff Rd
- 49 Prospect St