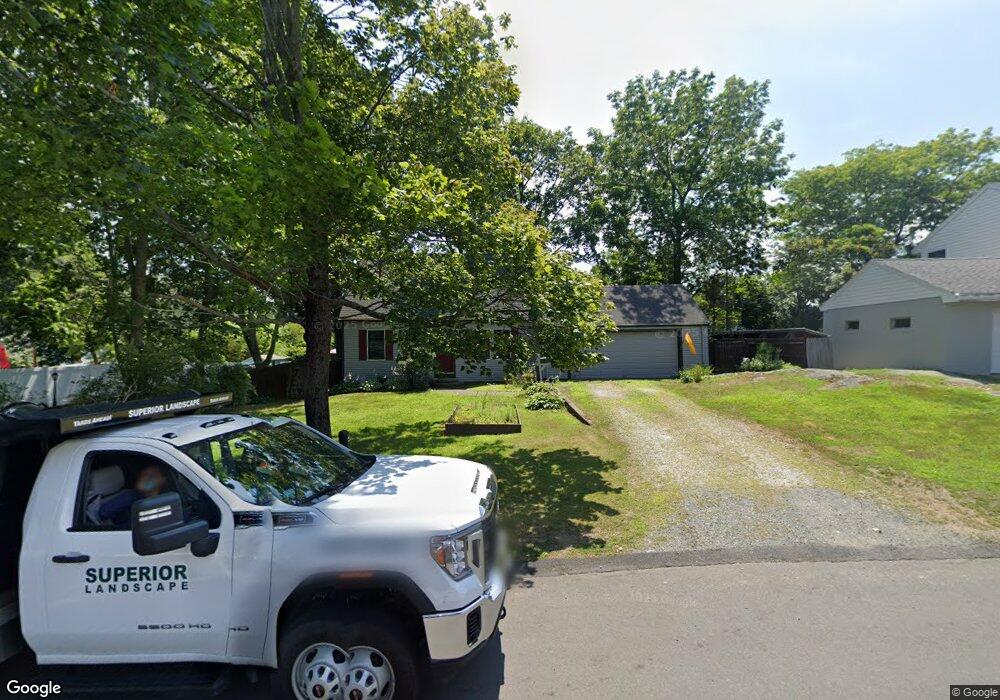
39 Bayview Rd Marblehead, MA 01945
Estimated Value: $745,000 - $821,000
3
Beds
1
Bath
1,260
Sq Ft
$620/Sq Ft
Est. Value
About This Home
This home is located at 39 Bayview Rd, Marblehead, MA 01945 and is currently estimated at $781,494, approximately $620 per square foot. 39 Bayview Rd is a home located in Essex County with nearby schools including Marblehead High School, Marblehead Community Charter Public School, and Tower School.
Ownership History
Date
Name
Owned For
Owner Type
Purchase Details
Closed on
Sep 27, 2010
Sold by
Macinnis Susan C and Macinnis George S
Bought by
Macinnis Susan C
Current Estimated Value
Home Financials for this Owner
Home Financials are based on the most recent Mortgage that was taken out on this home.
Original Mortgage
$235,770
Interest Rate
4.48%
Mortgage Type
Purchase Money Mortgage
Purchase Details
Closed on
Aug 1, 2001
Sold by
Smith Douglas G and Smith Dorothy M
Bought by
Macinnis Susan C and Macinnis George S
Create a Home Valuation Report for This Property
The Home Valuation Report is an in-depth analysis detailing your home's value as well as a comparison with similar homes in the area
Home Values in the Area
Average Home Value in this Area
Purchase History
| Date | Buyer | Sale Price | Title Company |
|---|---|---|---|
| Macinnis Susan C | -- | -- | |
| Macinnis Susan C | -- | -- | |
| Macinnis Susan C | $320,000 | -- | |
| Macinnis Susan C | $320,000 | -- |
Source: Public Records
Mortgage History
| Date | Status | Borrower | Loan Amount |
|---|---|---|---|
| Open | Macinnis Susan C | $209,000 | |
| Closed | Macinnis Susan C | $223,000 | |
| Closed | Macinnis Susan C | $235,770 |
Source: Public Records
Tax History Compared to Growth
Tax History
| Year | Tax Paid | Tax Assessment Tax Assessment Total Assessment is a certain percentage of the fair market value that is determined by local assessors to be the total taxable value of land and additions on the property. | Land | Improvement |
|---|---|---|---|---|
| 2025 | $6,376 | $704,500 | $519,900 | $184,600 |
| 2024 | $6,097 | $680,500 | $558,900 | $121,600 |
| 2023 | $6,205 | $620,500 | $487,400 | $133,100 |
| 2022 | $5,901 | $560,900 | $428,900 | $132,000 |
| 2021 | $5,709 | $547,900 | $415,900 | $132,000 |
| 2020 | $5,371 | $516,900 | $402,900 | $114,000 |
| 2019 | $5,259 | $489,700 | $376,900 | $112,800 |
| 2018 | $5,253 | $476,700 | $363,900 | $112,800 |
| 2017 | $4,819 | $437,700 | $324,900 | $112,800 |
| 2016 | $4,534 | $408,500 | $299,000 | $109,500 |
| 2015 | $4,308 | $388,800 | $286,000 | $102,800 |
| 2014 | $3,855 | $347,600 | $247,000 | $100,600 |
Source: Public Records
Map
Nearby Homes
- 24-26 Knight Ave
- 155 Village St
- 139 Jersey St
- 197A W Shore Dr Unit A
- 100 Village St
- 10 Shepard St
- 66 Jersey St
- 21 Reed St
- 70 Maverick St
- 51 Lincoln Ave
- 105 Green St Unit 4
- 29 Village St Unit 1
- 19 Linden St
- 31 Lincoln Park
- 148-150 Pleasant St Unit 2
- 29 Pinecliff Dr
- 290 Washington St
- 4 Cross St Unit 1
- 6 Higgins Rd
- 41 Rowland St