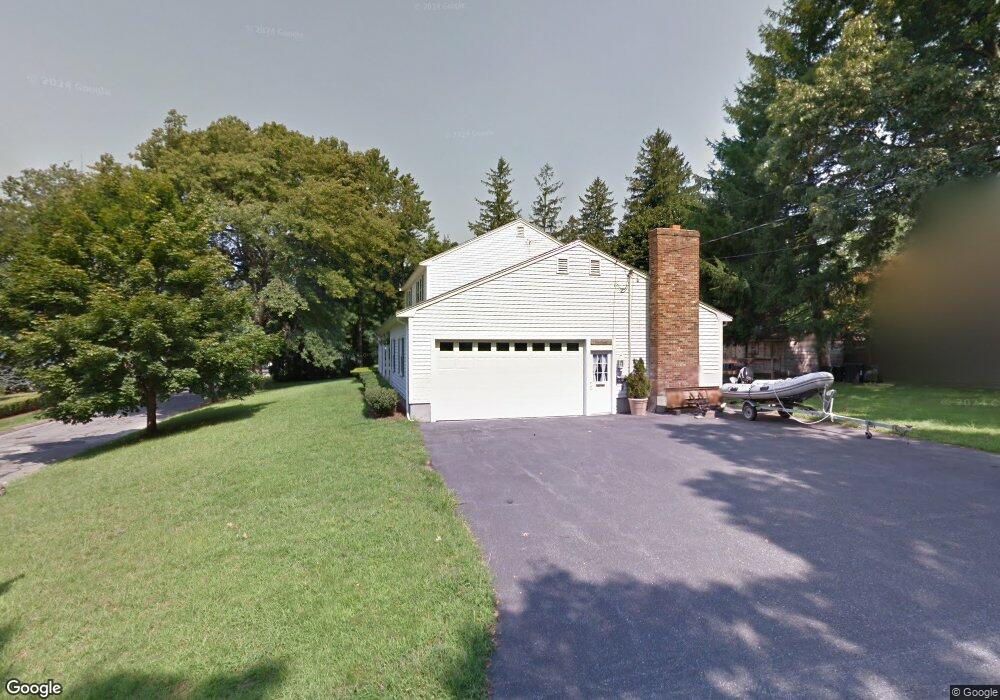
39 Bellevue Rd Stoneham, MA 02180
Bear Hill NeighborhoodEstimated Value: $1,077,000 - $1,154,000
4
Beds
3
Baths
2,054
Sq Ft
$537/Sq Ft
Est. Value
About This Home
This home is located at 39 Bellevue Rd, Stoneham, MA 02180 and is currently estimated at $1,102,109, approximately $536 per square foot. 39 Bellevue Rd is a home located in Middlesex County with nearby schools including Stoneham High School, St Joseph School, and St. Patrick Elementary School.
Ownership History
Date
Name
Owned For
Owner Type
Purchase Details
Closed on
Feb 9, 2023
Sold by
Iannuzzi Ralph and Iannuzzi Mary
Bought by
Iannuzzi Ralph and Iannuzzi Mary
Current Estimated Value
Purchase Details
Closed on
Sep 11, 1980
Bought by
Iannuzzi Ralph F and Iannuzzi Mary E
Create a Home Valuation Report for This Property
The Home Valuation Report is an in-depth analysis detailing your home's value as well as a comparison with similar homes in the area
Home Values in the Area
Average Home Value in this Area
Purchase History
| Date | Buyer | Sale Price | Title Company |
|---|---|---|---|
| Iannuzzi Ralph | -- | None Available | |
| Iannuzzi Ralph F | -- | -- |
Source: Public Records
Mortgage History
| Date | Status | Borrower | Loan Amount |
|---|---|---|---|
| Previous Owner | Iannuzzi Ralph F | $125,000 | |
| Previous Owner | Iannuzzi Ralph F | $97,000 |
Source: Public Records
Tax History
| Year | Tax Paid | Tax Assessment Tax Assessment Total Assessment is a certain percentage of the fair market value that is determined by local assessors to be the total taxable value of land and additions on the property. | Land | Improvement |
|---|---|---|---|---|
| 2025 | $10,100 | $987,300 | $441,100 | $546,200 |
| 2024 | $9,211 | $869,800 | $401,100 | $468,700 |
| 2023 | $8,901 | $801,900 | $361,100 | $440,800 |
| 2022 | $7,873 | $756,300 | $341,100 | $415,200 |
| 2021 | $7,583 | $736,700 | $331,100 | $405,600 |
| 2020 | $6,646 | $726,300 | $321,100 | $405,200 |
| 2019 | $8,016 | $714,400 | $321,100 | $393,300 |
| 2018 | $13,065 | $658,600 | $301,100 | $357,500 |
| 2017 | $7,874 | $635,500 | $291,100 | $344,400 |
| 2016 | $7,602 | $598,600 | $281,100 | $317,500 |
| 2015 | $7,370 | $568,700 | $261,100 | $307,600 |
| 2014 | $7,634 | $565,900 | $261,100 | $304,800 |
Source: Public Records
Map
Nearby Homes
- 95 Prospect St
- 62 High St Unit Lot 7
- 66 Main St Unit 47A
- 36 Pine Hill Cir
- 1 Summit Dr Unit 57
- 293 Albion St
- 1010 Gazebo Cir
- 3 Western Ave
- 106 Elm St
- 159 Main St Unit 52B
- 62 Foundry St Unit 310
- 62 Foundry St Unit 208
- 62 Foundry St Unit 202
- 2 Savin Rd
- 13 Chestnut St Unit 1
- 24 W Water St
- 84 Curtis St
- 33 Old Farm Rd
- 241 Main St Unit C3
- 20 Pinevale Ave
Your Personal Tour Guide
Ask me questions while you tour the home.