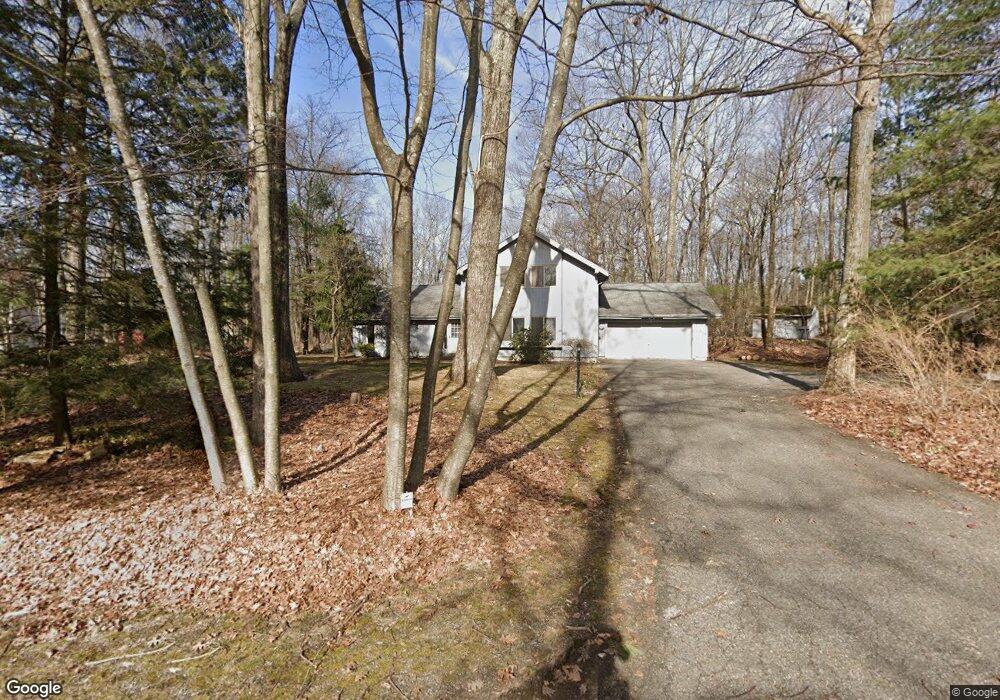
39 Bilberry Rd Bridgewater, CT 06752
Estimated Value: $560,645 - $657,000
3
Beds
3
Baths
2,045
Sq Ft
$299/Sq Ft
Est. Value
About This Home
This home is located at 39 Bilberry Rd, Bridgewater, CT 06752 and is currently estimated at $611,161, approximately $298 per square foot. 39 Bilberry Rd is a home located in Litchfield County with nearby schools including Shepaug Valley School.
Ownership History
Date
Name
Owned For
Owner Type
Purchase Details
Closed on
Mar 21, 2024
Sold by
Graham Julian
Bought by
Graham Linda S
Current Estimated Value
Purchase Details
Closed on
Mar 17, 1998
Sold by
Ciafone Jeff and Ciafone Tammy
Bought by
Graham Julian and Graham Linda
Home Financials for this Owner
Home Financials are based on the most recent Mortgage that was taken out on this home.
Original Mortgage
$151,000
Interest Rate
7.03%
Mortgage Type
Purchase Money Mortgage
Purchase Details
Closed on
May 31, 1994
Sold by
Nicol Robert and Nicol Deborah
Bought by
Ciafone Jeff and Ciafone Tammy
Purchase Details
Closed on
Feb 15, 1991
Sold by
Buonaiuto Valentine and Buonaiuto Judith
Bought by
Nicol Robert P and Nicol Deborah
Create a Home Valuation Report for This Property
The Home Valuation Report is an in-depth analysis detailing your home's value as well as a comparison with similar homes in the area
Home Values in the Area
Average Home Value in this Area
Purchase History
| Date | Buyer | Sale Price | Title Company |
|---|---|---|---|
| Graham Linda S | -- | None Available | |
| Graham Linda S | -- | None Available | |
| Graham Linda S | -- | None Available | |
| Graham Julian | $211,000 | -- | |
| Ciafone Jeff | $223,500 | -- | |
| Graham Julian | $211,000 | -- | |
| Ciafone Jeff | $223,500 | -- | |
| Nicol Robert P | $215,000 | -- |
Source: Public Records
Mortgage History
| Date | Status | Borrower | Loan Amount |
|---|---|---|---|
| Previous Owner | Nicol Robert P | $303,000 | |
| Previous Owner | Nicol Robert P | $144,500 | |
| Previous Owner | Nicol Robert P | $151,000 |
Source: Public Records
Tax History
| Year | Tax Paid | Tax Assessment Tax Assessment Total Assessment is a certain percentage of the fair market value that is determined by local assessors to be the total taxable value of land and additions on the property. | Land | Improvement |
|---|---|---|---|---|
| 2025 | $5,529 | $291,000 | $96,900 | $194,100 |
| 2024 | $5,165 | $291,000 | $96,900 | $194,100 |
| 2023 | $4,874 | $291,000 | $96,900 | $194,100 |
| 2022 | $4,142 | $223,900 | $115,800 | $108,100 |
| 2021 | $5,447 | $223,900 | $115,800 | $108,100 |
| 2020 | $3,918 | $223,900 | $115,800 | $108,100 |
| 2019 | $5,606 | $223,900 | $115,800 | $108,100 |
| 2018 | $5,200 | $223,900 | $115,800 | $108,100 |
| 2017 | $3,851 | $223,900 | $115,800 | $108,100 |
| 2016 | $4,585 | $278,700 | $116,200 | $162,500 |
| 2015 | $4,808 | $278,700 | $116,200 | $162,500 |
| 2014 | $4,808 | $278,700 | $116,200 | $162,500 |
Source: Public Records
Map
Nearby Homes
- 49 Bilberry Rd
- 29 Bilberry Rd
- 30 Bilberry Rd
- 40 Bilberry Rd
- 50 Bilberry Rd
- 25 Bilberry Rd
- 57 Bilberry Rd
- 20 Bilberry Rd
- 70 Bilberry Rd
- 21 Bilberry Rd
- 19 Bilberry Rd
- 80 Bilberry Rd
- 15 Bilberry Rd
- 71 Bilberry Rd
- 9 Bilberry Rd
- 117 Blueberry Hill Rd
- 109 Blueberry Hill Rd
- 93 Blueberry Hill Rd
- 99 Blueberry Hill Rd
- 114 Blueberry Hill Rd
Your Personal Tour Guide
Ask me questions while you tour the home.