39 Black Horse Ln Unit A Cohasset, MA 02025
Estimated Value: $2,195,000 - $4,135,000
1
Bed
1
Bath
700
Sq Ft
$4,859/Sq Ft
Est. Value
About This Home
This home is located at 39 Black Horse Ln Unit A, Cohasset, MA 02025 and is currently estimated at $3,401,054, approximately $4,858 per square foot. 39 Black Horse Ln Unit A is a home located in Norfolk County with nearby schools including Joseph Osgood School, Deer Hill School, and Cohasset Middle School.
Ownership History
Date
Name
Owned For
Owner Type
Purchase Details
Closed on
Jun 25, 1991
Sold by
Hingham Inst For Svgs
Bought by
Stone Peter L and Stone Margaret C
Current Estimated Value
Purchase Details
Closed on
Jan 3, 1991
Sold by
Est Crossen Joseph F
Bought by
Hingham Inst For Svgs
Create a Home Valuation Report for This Property
The Home Valuation Report is an in-depth analysis detailing your home's value as well as a comparison with similar homes in the area
Home Values in the Area
Average Home Value in this Area
Purchase History
| Date | Buyer | Sale Price | Title Company |
|---|---|---|---|
| Stone Peter L | $800,000 | -- | |
| Hingham Inst For Svgs | $840,000 | -- |
Source: Public Records
Mortgage History
| Date | Status | Borrower | Loan Amount |
|---|---|---|---|
| Open | Hingham Inst For Svgs | $845,000 | |
| Closed | Hingham Inst For Svgs | $900,000 | |
| Closed | Hingham Inst For Svgs | $600,000 |
Source: Public Records
Tax History Compared to Growth
Tax History
| Year | Tax Paid | Tax Assessment Tax Assessment Total Assessment is a certain percentage of the fair market value that is determined by local assessors to be the total taxable value of land and additions on the property. | Land | Improvement |
|---|---|---|---|---|
| 2025 | $35,609 | $3,075,000 | $1,633,600 | $1,441,400 |
| 2024 | $35,080 | $2,882,500 | $1,484,800 | $1,397,700 |
| 2023 | $28,459 | $2,411,800 | $1,119,400 | $1,292,400 |
| 2022 | $28,186 | $2,244,100 | $1,119,400 | $1,124,700 |
| 2021 | $27,928 | $2,141,700 | $1,119,400 | $1,022,300 |
| 2020 | $27,703 | $2,135,900 | $1,119,400 | $1,016,500 |
| 2019 | $27,553 | $2,135,900 | $1,119,400 | $1,016,500 |
| 2018 | $27,318 | $2,135,900 | $1,119,400 | $1,016,500 |
| 2017 | $26,747 | $2,048,000 | $1,119,400 | $928,600 |
| 2016 | $26,378 | $2,048,000 | $1,119,400 | $928,600 |
| 2015 | $26,030 | $2,048,000 | $1,119,400 | $928,600 |
| 2014 | $24,198 | $1,929,700 | $1,001,100 | $928,600 |
Source: Public Records
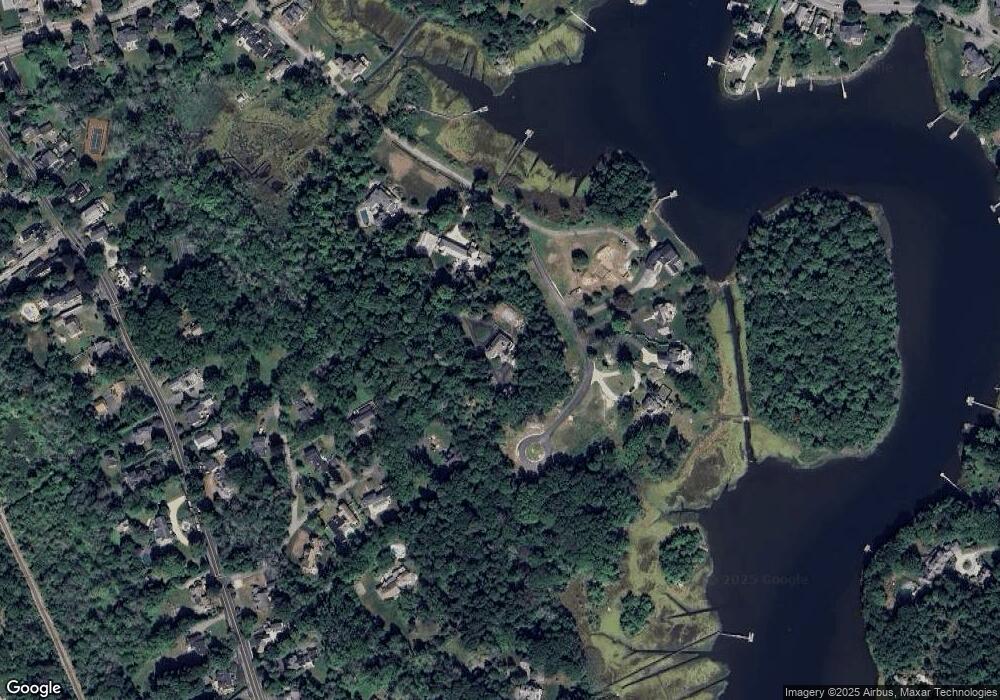
Map
Nearby Homes
- 68 Black Horse Ln
- 70 Black Horse Ln
- 98 Black Horse Ln
- 212 S Main St
- 309 S Main St
- 124 Elm St Unit 202
- 124 Elm St Unit 308
- 87 Elm St Unit 215
- 4 Margin St Unit A
- 40 Pond St
- 21-23 Elm Ct
- 128 Elm St Unit 211
- 100 Pond St Unit 10
- 392 S Main St
- 26 Ash St
- 104 Howard Gleason Rd
- 73 Pond St
- 100 Howard Gleason Rd
- 24 Wood Island Rd
- 817 Country Way
- 39 Black Horse Ln
- 39 Black Horse Ln
- 39 Black Horse Ln Unit 39
- 39 Black Horse Ln Unit 2
- 39 Black Horse Ln
- 39 Black Horse Ln
- 55 Black Horse Ln
- Lot 21 Black Horse Place Unit 21
- 20 Westgate Ln
- 94 Black Horse Ln
- 15 Westgate Ln
- 80 Black Horse Ln
- 70 Black Horse Ln
- 70 Black Horse Ln
- 90 Black Horse Ln
- 8 Westgate Ln
- 43 Black Horse Ln
- 11 Windsor Rd
- 6 Westgate Ln
- 30 Cedar Ln