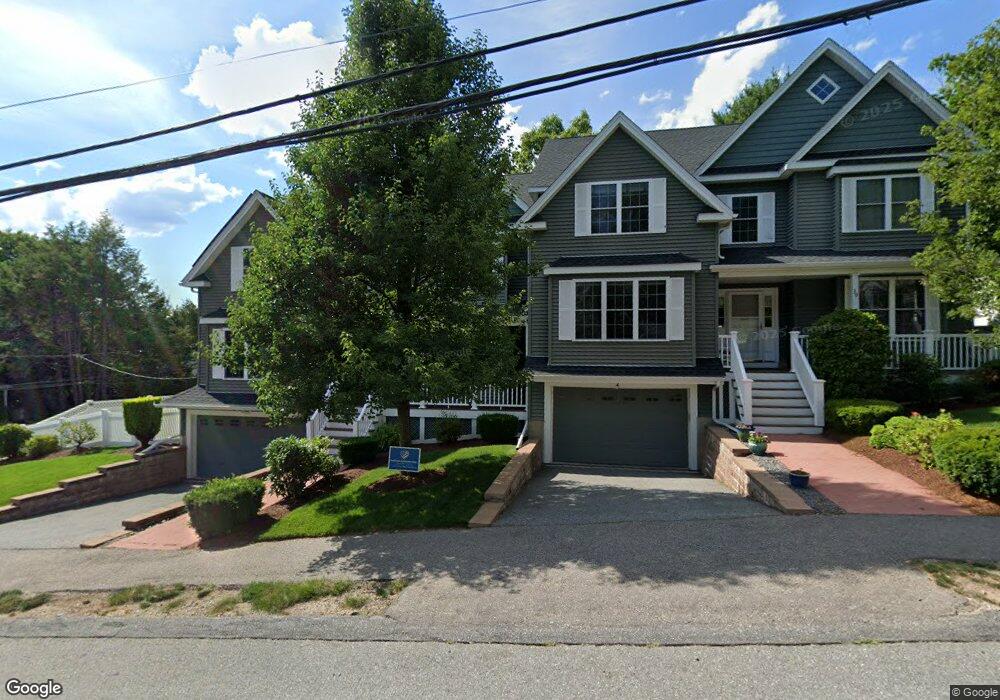
39 Bobsled Dr Needham Heights, MA 02494
Estimated Value: $1,273,000 - $1,580,000
4
Beds
4
Baths
3,157
Sq Ft
$464/Sq Ft
Est. Value
About This Home
This home is located at 39 Bobsled Dr, Needham Heights, MA 02494 and is currently estimated at $1,466,044, approximately $464 per square foot. 39 Bobsled Dr is a home located in Norfolk County with nearby schools including Sunita L. Williams Elementary School, High Rock Middle School, and Pollard Middle School.
Ownership History
Date
Name
Owned For
Owner Type
Purchase Details
Closed on
Aug 15, 2008
Sold by
North Shore Constr & Dev
Bought by
Cabon Christine and Cabon Francois
Current Estimated Value
Home Financials for this Owner
Home Financials are based on the most recent Mortgage that was taken out on this home.
Original Mortgage
$500,000
Outstanding Balance
$329,289
Interest Rate
6.4%
Mortgage Type
Purchase Money Mortgage
Estimated Equity
$1,136,755
Create a Home Valuation Report for This Property
The Home Valuation Report is an in-depth analysis detailing your home's value as well as a comparison with similar homes in the area
Home Values in the Area
Average Home Value in this Area
Purchase History
| Date | Buyer | Sale Price | Title Company |
|---|---|---|---|
| Cabon Christine | $799,075 | -- | |
| Cabon Christine | $799,075 | -- |
Source: Public Records
Mortgage History
| Date | Status | Borrower | Loan Amount |
|---|---|---|---|
| Open | Cabon Christine | $500,000 | |
| Closed | Cabon Christine | $500,000 |
Source: Public Records
Tax History Compared to Growth
Tax History
| Year | Tax Paid | Tax Assessment Tax Assessment Total Assessment is a certain percentage of the fair market value that is determined by local assessors to be the total taxable value of land and additions on the property. | Land | Improvement |
|---|---|---|---|---|
| 2025 | $15,860 | $1,496,200 | $0 | $1,496,200 |
| 2024 | $14,754 | $1,178,400 | $0 | $1,178,400 |
| 2023 | $14,776 | $1,133,100 | $0 | $1,133,100 |
| 2022 | $14,293 | $1,069,000 | $0 | $1,069,000 |
| 2021 | $13,929 | $1,069,000 | $0 | $1,069,000 |
| 2020 | $13,352 | $1,069,000 | $0 | $1,069,000 |
| 2019 | $11,564 | $933,300 | $0 | $933,300 |
| 2018 | $10,663 | $897,600 | $0 | $897,600 |
| 2017 | $10,170 | $855,300 | $0 | $855,300 |
| 2016 | $9,852 | $853,700 | $0 | $853,700 |
| 2015 | $9,638 | $853,700 | $0 | $853,700 |
| 2014 | $9,729 | $835,800 | $0 | $835,800 |
Source: Public Records
Map
Nearby Homes
- 35 Andrea Cir
- 263 Hunnewell St
- 70 Booth St
- 379 Hunnewell St Unit 379
- 381 Hunnewell St Unit 381
- 403 Hunnewell St Unit 403
- 132 Hillside Ave
- 443 Central Ave
- 400 Hunnewell St Unit 103
- 7 Avery St
- 48 Taylor St
- 760 Highland Ave Unit 2
- 208 Webster St
- 445 Hillside Ave
- 28 Mercer Rd
- 14 Hunnewell St
- 36 Davenport Rd
- 609 Hunnewell St
- 78 Hunnewell St
- 71 Brookside Rd
- 41 Bobsled Dr
- 110 Booth St
- 31 Bobsled Dr
- 31 Bobsled Dr Unit 31
- 31 Bobsled Dr Unit 1
- 33 Bobsled Dr
- 40 Bobsled Dr
- 40 Bobsled Dr Unit 40
- 42 Bobsled Dr
- 117 Booth St
- 115 Booth St
- 117 Booth St Unit 115
- 34 Bobsled Dr
- 32 Bobsled Dr
- 32 Bobsled Dr Unit 22
- 102 Booth St
- 109 Booth St
- 25 Castano Ct
- 125 Booth St
- 125 Booth St Unit 125