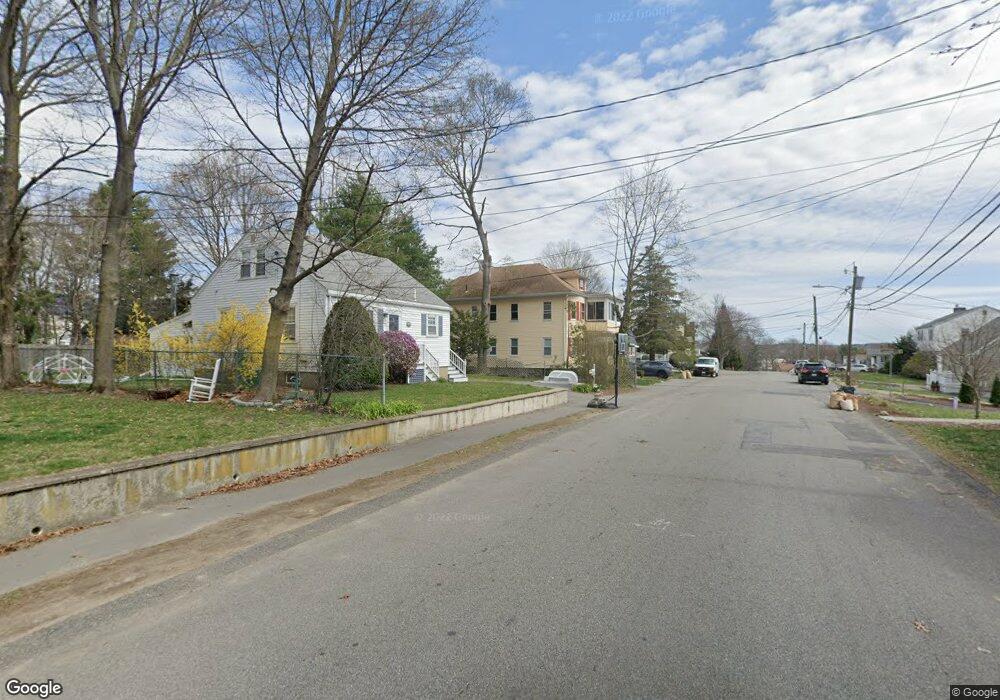
39 Border St Dedham, MA 02026
Oakdale NeighborhoodEstimated Value: $812,000 - $930,000
4
Beds
2
Baths
2,388
Sq Ft
$363/Sq Ft
Est. Value
About This Home
This home is located at 39 Border St, Dedham, MA 02026 and is currently estimated at $866,879, approximately $363 per square foot. 39 Border St is a home located in Norfolk County with nearby schools including Oakdale Elementary School, Dedham Middle School, and Dedham High School.
Ownership History
Date
Name
Owned For
Owner Type
Purchase Details
Closed on
Aug 28, 2002
Sold by
Brousaides Harry C and Brousaides Phyllis A
Bought by
Looby Daniel and Looby Kim
Current Estimated Value
Home Financials for this Owner
Home Financials are based on the most recent Mortgage that was taken out on this home.
Original Mortgage
$320,000
Outstanding Balance
$136,695
Interest Rate
6.55%
Mortgage Type
Purchase Money Mortgage
Estimated Equity
$730,184
Create a Home Valuation Report for This Property
The Home Valuation Report is an in-depth analysis detailing your home's value as well as a comparison with similar homes in the area
Home Values in the Area
Average Home Value in this Area
Purchase History
| Date | Buyer | Sale Price | Title Company |
|---|---|---|---|
| Looby Daniel | $404,000 | -- |
Source: Public Records
Mortgage History
| Date | Status | Borrower | Loan Amount |
|---|---|---|---|
| Open | Looby Daniel | $320,000 |
Source: Public Records
Tax History
| Year | Tax Paid | Tax Assessment Tax Assessment Total Assessment is a certain percentage of the fair market value that is determined by local assessors to be the total taxable value of land and additions on the property. | Land | Improvement |
|---|---|---|---|---|
| 2025 | $9,863 | $781,500 | $317,700 | $463,800 |
| 2024 | $9,174 | $733,900 | $288,300 | $445,600 |
| 2023 | $8,663 | $674,700 | $261,000 | $413,700 |
| 2022 | $8,013 | $600,200 | $245,100 | $355,100 |
| 2021 | $7,726 | $565,200 | $227,000 | $338,200 |
| 2020 | $7,435 | $541,900 | $227,000 | $314,900 |
| 2019 | $6,966 | $492,300 | $197,400 | $294,900 |
| 2018 | $6,674 | $458,700 | $175,000 | $283,700 |
| 2017 | $6,062 | $410,700 | $164,000 | $246,700 |
| 2016 | $5,956 | $384,500 | $151,800 | $232,700 |
| 2015 | $5,893 | $371,300 | $144,500 | $226,800 |
| 2014 | $5,773 | $359,000 | $141,900 | $217,100 |
Source: Public Records
Map
Nearby Homes
Your Personal Tour Guide
Ask me questions while you tour the home.