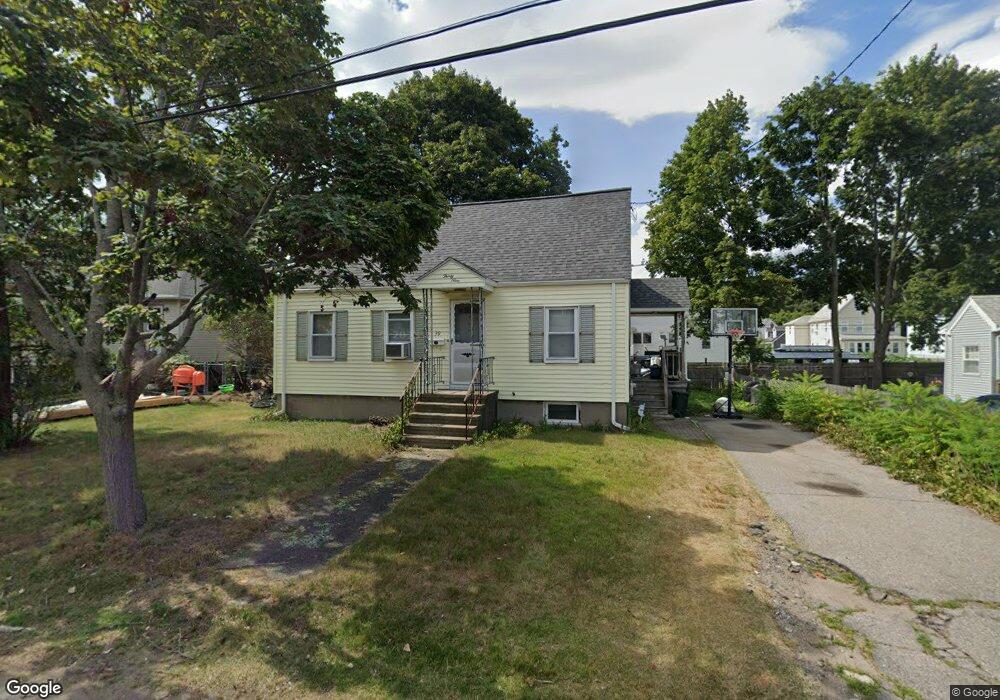
39 Branch St Quincy, MA 02169
South Quincy NeighborhoodEstimated Value: $576,000 - $748,000
3
Beds
2
Baths
1,260
Sq Ft
$516/Sq Ft
Est. Value
About This Home
This home is located at 39 Branch St, Quincy, MA 02169 and is currently estimated at $650,026, approximately $515 per square foot. 39 Branch St is a home located in Norfolk County with nearby schools including South West Middle School, Lincoln-Hancock Community School, and Quincy High School.
Ownership History
Date
Name
Owned For
Owner Type
Purchase Details
Closed on
Jul 22, 2002
Sold by
Miele Michael
Bought by
Deboer Erik R and Deboer Christine A
Current Estimated Value
Home Financials for this Owner
Home Financials are based on the most recent Mortgage that was taken out on this home.
Original Mortgage
$192,000
Outstanding Balance
$81,508
Interest Rate
6.73%
Mortgage Type
Purchase Money Mortgage
Estimated Equity
$568,518
Create a Home Valuation Report for This Property
The Home Valuation Report is an in-depth analysis detailing your home's value as well as a comparison with similar homes in the area
Home Values in the Area
Average Home Value in this Area
Purchase History
| Date | Buyer | Sale Price | Title Company |
|---|---|---|---|
| Deboer Erik R | $240,000 | -- |
Source: Public Records
Mortgage History
| Date | Status | Borrower | Loan Amount |
|---|---|---|---|
| Open | Deboer Erik R | $192,000 |
Source: Public Records
Tax History Compared to Growth
Tax History
| Year | Tax Paid | Tax Assessment Tax Assessment Total Assessment is a certain percentage of the fair market value that is determined by local assessors to be the total taxable value of land and additions on the property. | Land | Improvement |
|---|---|---|---|---|
| 2025 | $6,020 | $522,100 | $272,400 | $249,700 |
| 2024 | $5,714 | $507,000 | $259,400 | $247,600 |
| 2023 | $5,201 | $467,300 | $235,900 | $231,400 |
| 2022 | $4,978 | $415,500 | $196,500 | $219,000 |
| 2021 | $4,947 | $407,500 | $196,500 | $211,000 |
| 2020 | $4,932 | $396,800 | $196,500 | $200,300 |
| 2019 | $4,543 | $362,000 | $185,500 | $176,500 |
| 2018 | $4,556 | $341,500 | $171,700 | $169,800 |
| 2017 | $4,452 | $314,200 | $163,500 | $150,700 |
| 2016 | $4,071 | $283,500 | $142,200 | $141,300 |
| 2015 | $3,973 | $272,100 | $142,200 | $129,900 |
| 2014 | $3,760 | $253,000 | $142,200 | $110,800 |
Source: Public Records
Map
Nearby Homes
- 21 Totman St Unit 202
- 21 Totman St Unit 309
- 21 Totman St Unit Model-1
- 21 Totman St Unit 209
- 21 Totman St Unit 203
- 21 Totman St Unit 2
- 347 Centre St
- 118 Brook Rd Unit 2
- 94 Brook Rd Unit 3
- 56 Penn St Unit 4
- 21 Arthur St
- 42 West St
- 91 Garfield St
- 64 Garfield St Unit B
- 14 Arthur Ave
- 12 Arthur Ave
- 57 Buckley St
- 46-48 Buckley St
- 51 Brook Rd
- 72 Federal Ave
- 33 Branch St
- 41 Branch St
- 40 Albertina St
- 48 Albertina St
- 27 Branch St
- 47 Branch St Unit A
- 47 Branch St Unit 1
- 46 Albertina St
- 38 Branch St
- 30 Albertina St
- 52 Albertina St
- 52 Albertina St Unit 1/F
- 52 Albertina St Unit garage
- 52 Albertina St Unit 2/F + 3/F
- 42 Branch St
- 42-46 Branch St
- 23 Branch St Unit 3
- 23 Branch St
- 23 Branch St Unit 5
- 51 Branch St Unit 1