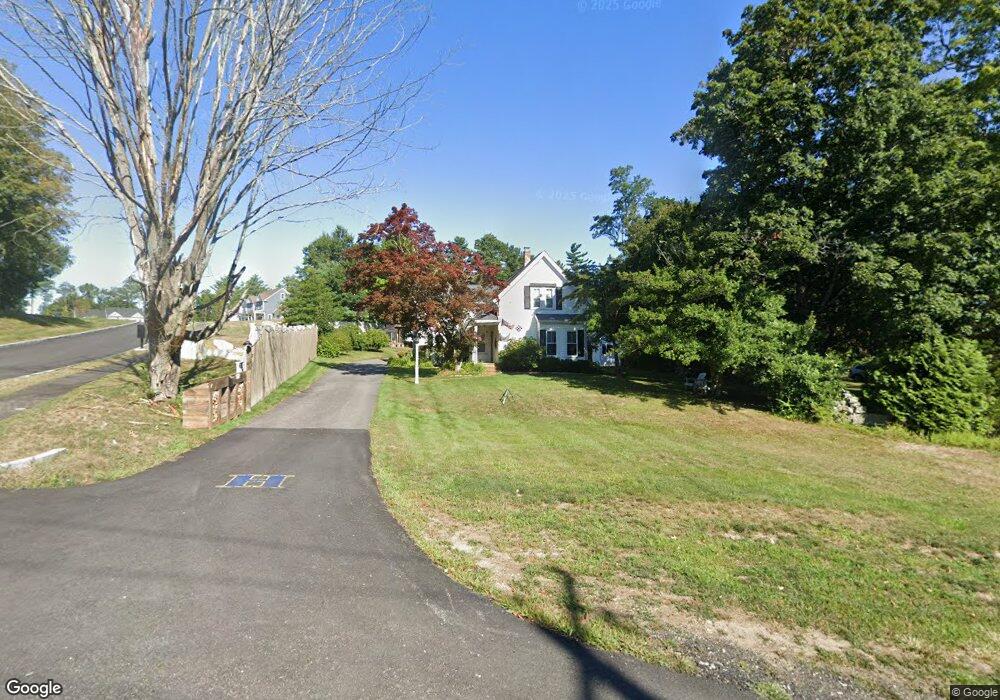
39 Broadway Hanover, MA 02339
Estimated Value: $799,223 - $893,000
3
Beds
2
Baths
2,113
Sq Ft
$396/Sq Ft
Est. Value
About This Home
This home is located at 39 Broadway, Hanover, MA 02339 and is currently estimated at $836,806, approximately $396 per square foot. 39 Broadway is a home located in Plymouth County with nearby schools including Hanover High School, Cadence Academy Preschool - Hanover, and The Master's Academy.
Ownership History
Date
Name
Owned For
Owner Type
Purchase Details
Closed on
Feb 11, 2005
Sold by
Egan Brian Christoph
Bought by
Egan Brian Christoph
Current Estimated Value
Home Financials for this Owner
Home Financials are based on the most recent Mortgage that was taken out on this home.
Original Mortgage
$225,000
Interest Rate
5.83%
Mortgage Type
Purchase Money Mortgage
Purchase Details
Closed on
Feb 29, 1996
Sold by
Broadway Rt and Muncey Peter
Bought by
Egan Brian C
Create a Home Valuation Report for This Property
The Home Valuation Report is an in-depth analysis detailing your home's value as well as a comparison with similar homes in the area
Home Values in the Area
Average Home Value in this Area
Purchase History
| Date | Buyer | Sale Price | Title Company |
|---|---|---|---|
| Egan Brian Christoph | -- | -- | |
| Egan Brian C | $205,000 | -- |
Source: Public Records
Mortgage History
| Date | Status | Borrower | Loan Amount |
|---|---|---|---|
| Open | Egan Brian C | $200,000 | |
| Closed | Egan Brian C | $205,000 | |
| Closed | Egan Brian C | $225,000 | |
| Previous Owner | Egan Brian C | $136,500 |
Source: Public Records
Tax History
| Year | Tax Paid | Tax Assessment Tax Assessment Total Assessment is a certain percentage of the fair market value that is determined by local assessors to be the total taxable value of land and additions on the property. | Land | Improvement |
|---|---|---|---|---|
| 2025 | $8,727 | $706,600 | $335,600 | $371,000 |
| 2024 | $8,549 | $665,800 | $335,600 | $330,200 |
| 2023 | $8,385 | $621,600 | $305,300 | $316,300 |
| 2022 | $7,913 | $518,900 | $254,400 | $264,500 |
| 2021 | $0 | $495,800 | $231,300 | $264,500 |
| 2020 | $81 | $492,000 | $231,300 | $260,700 |
| 2019 | $7,640 | $465,600 | $231,300 | $234,300 |
| 2018 | $7,583 | $465,800 | $231,300 | $234,500 |
| 2017 | $7,188 | $435,100 | $236,700 | $198,400 |
| 2016 | $6,850 | $406,300 | $215,100 | $191,200 |
| 2015 | $6,093 | $377,300 | $234,700 | $142,600 |
Source: Public Records
Map
Nearby Homes
- 26 Church St
- 365 Broadway
- 33 1st Parish Ln
- 70 River Rd
- 186 Elm St
- 68 East St
- 145 Brigantine Cir
- 75 Masthead Dr
- 422 River St
- 172 Washington St
- 26 Blake Ave
- 60 Summer Path Way
- 114 Graham Hill Dr
- 261 Washington St
- 23 John Neil Dr
- 269 Washington St Unit A1
- 285 W Elm St
- 38 Centennial Way
- 51 Farmside Dr
- 168 Larchmont Ln
Your Personal Tour Guide
Ask me questions while you tour the home.