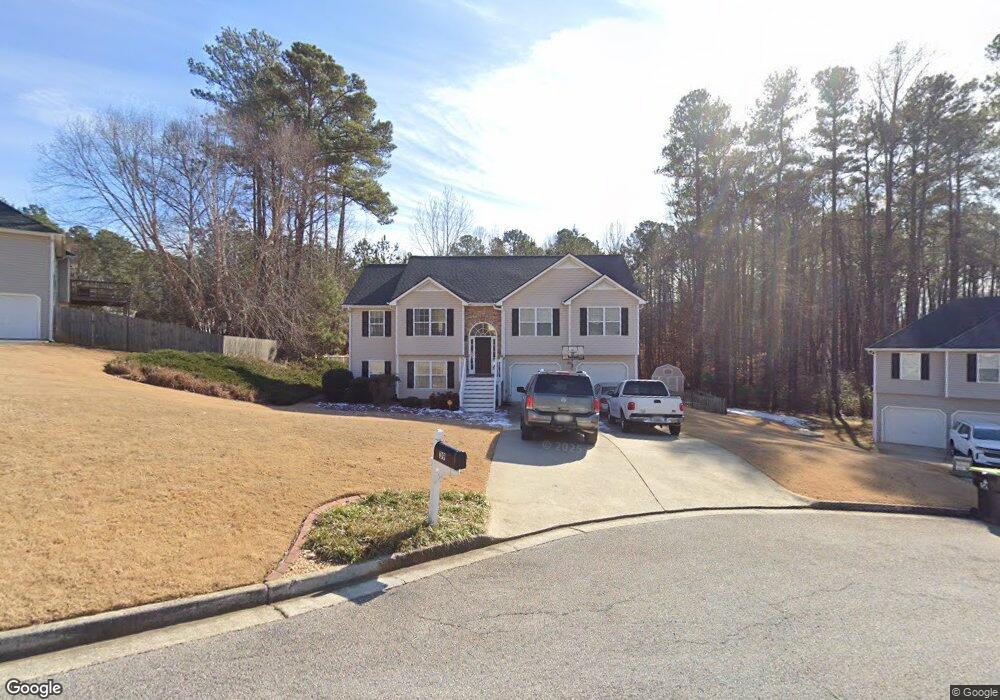
39 Brookview Ln Unit 57 Dallas, GA 30132
Cedarcrest NeighborhoodEstimated Value: $357,000 - $416,000
4
Beds
3
Baths
1,757
Sq Ft
$220/Sq Ft
Est. Value
About This Home
This home is located at 39 Brookview Ln Unit 57, Dallas, GA 30132 and is currently estimated at $385,925, approximately $219 per square foot. 39 Brookview Ln Unit 57 is a home located in Paulding County with nearby schools including W.C. Abney Elementary School, Lena Mae Moses Middle School, and North Paulding High School.
Ownership History
Date
Name
Owned For
Owner Type
Purchase Details
Closed on
Oct 29, 2024
Sold by
Rogers Darlene
Bought by
Rogers Roy and Rogers Theresa
Current Estimated Value
Purchase Details
Closed on
Mar 28, 2019
Sold by
Rogers Theresa
Bought by
Rogers Theresa and Rogers Darlene
Purchase Details
Closed on
May 14, 2018
Sold by
Wamsley Seth M
Bought by
Rogers Theresa
Home Financials for this Owner
Home Financials are based on the most recent Mortgage that was taken out on this home.
Original Mortgage
$224,155
Interest Rate
5.25%
Mortgage Type
FHA
Purchase Details
Closed on
Feb 11, 2005
Sold by
Pine Grove Builders Inc
Bought by
Wamsley Seth M
Home Financials for this Owner
Home Financials are based on the most recent Mortgage that was taken out on this home.
Original Mortgage
$154,473
Interest Rate
5.68%
Mortgage Type
VA
Create a Home Valuation Report for This Property
The Home Valuation Report is an in-depth analysis detailing your home's value as well as a comparison with similar homes in the area
Home Values in the Area
Average Home Value in this Area
Purchase History
| Date | Buyer | Sale Price | Title Company |
|---|---|---|---|
| Rogers Roy | -- | -- | |
| Rogers Theresa | -- | -- | |
| Rogers Theresa | $232,000 | -- | |
| Wamsley Seth M | $156,900 | -- |
Source: Public Records
Mortgage History
| Date | Status | Borrower | Loan Amount |
|---|---|---|---|
| Previous Owner | Rogers Theresa | $224,155 | |
| Previous Owner | Wamsley Seth M | $154,473 |
Source: Public Records
Tax History Compared to Growth
Tax History
| Year | Tax Paid | Tax Assessment Tax Assessment Total Assessment is a certain percentage of the fair market value that is determined by local assessors to be the total taxable value of land and additions on the property. | Land | Improvement |
|---|---|---|---|---|
| 2024 | $3,559 | $146,304 | $14,000 | $132,304 |
| 2023 | $3,505 | $136,988 | $14,000 | $122,988 |
| 2022 | $3,050 | $118,884 | $14,000 | $104,884 |
| 2021 | $2,584 | $90,792 | $14,000 | $76,792 |
| 2020 | $2,379 | $81,952 | $14,000 | $67,952 |
| 2019 | $2,426 | $82,380 | $14,000 | $68,380 |
| 2018 | $2,124 | $72,372 | $16,000 | $56,372 |
| 2017 | $2,192 | $73,604 | $16,400 | $57,204 |
| 2016 | $2,042 | $69,412 | $16,400 | $53,012 |
| 2015 | $1,838 | $61,560 | $16,400 | $45,160 |
| 2014 | $1,669 | $54,744 | $16,400 | $38,344 |
| 2013 | -- | $43,120 | $16,400 | $26,720 |
Source: Public Records
Map
Nearby Homes
- 35 Indigo Ct
- 140 Crepe Myrtle Way
- 244 Freestone Ln
- 173 Barberry Ln
- 77 Oliver Ridge
- 6275 Dallas Acworth Hwy
- 160 Northridge Dr
- 232 Northridge Dr
- 366 Charles Ridge Unit 53
- 0 Dallas Acworth Hwy Unit 10624105
- 0 Dallas Acworth Hwy Unit 7665160
- 123 Possum Creek Ln
- 529 Red Fox Dr
- 385 Thompson Ridge Ln
- 384 Thompson Ridge Ln
- 381 Thompson Ridge Ln
- 102 Park Ln
- 39 Brookview Ln
- 47 Brookview Ln
- 15 Brookview Ln
- 0 Brookview Ln Unit 7475502
- 0 Brookview Ln
- 52 Brookview Ln
- 14 Brookview Ln
- 50 Brookview Ln
- 192 Oakleigh Ln
- 40 Brookview Ln
- 214 Oakleigh Ln
- 207 Holbrook Dr
- 191 Holbrook Dr
- 221 Holbrook Dr
- 172 Oakleigh Ln
- 0 Oakleigh Ln Unit 8791668
- 0 Oakleigh Ln Unit 8692328
- 0 Oakleigh Ln Unit 8167392
- 0 Oakleigh Ln Unit 8140163
- 0 Oakleigh Ln Unit 8024917