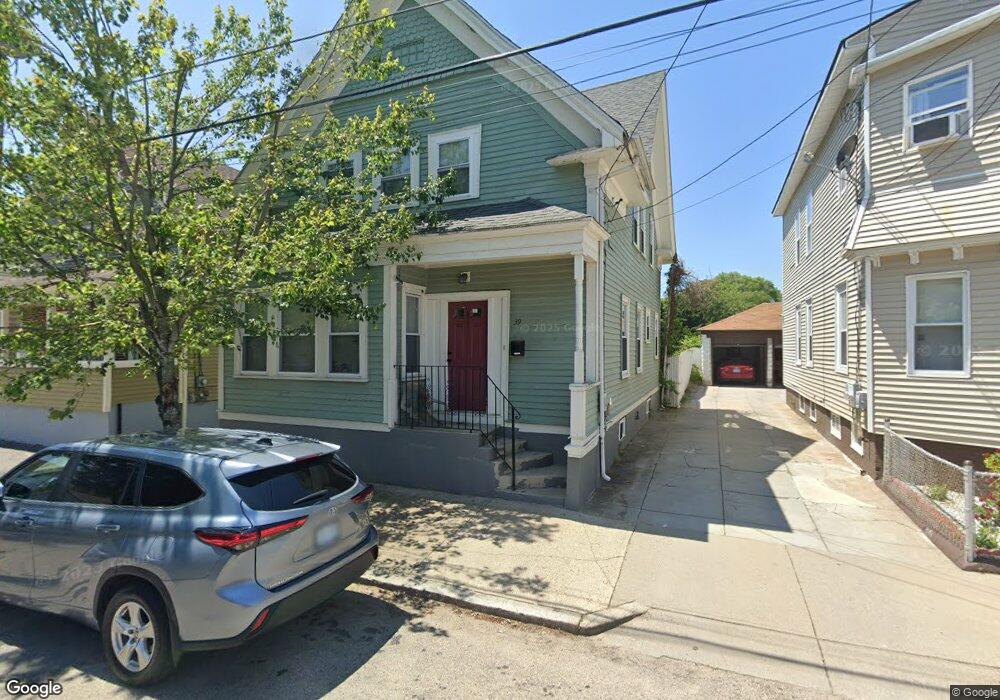
39 Burnside St Providence, RI 02905
Lower South Providence NeighborhoodEstimated Value: $360,000 - $406,000
4
Beds
2
Baths
1,632
Sq Ft
$231/Sq Ft
Est. Value
About This Home
This home is located at 39 Burnside St, Providence, RI 02905 and is currently estimated at $376,285, approximately $230 per square foot. 39 Burnside St is a home located in Providence County with nearby schools including Asa Messer Elementary School, Charles N. Fortes Elementary School, and Robert L. Bailey IV Elementary.
Ownership History
Date
Name
Owned For
Owner Type
Purchase Details
Closed on
Dec 3, 2012
Sold by
Swap Inc
Bought by
Hoff Priscilla L
Current Estimated Value
Home Financials for this Owner
Home Financials are based on the most recent Mortgage that was taken out on this home.
Original Mortgage
$104,000
Outstanding Balance
$71,900
Interest Rate
3.4%
Estimated Equity
$304,385
Purchase Details
Closed on
May 18, 2009
Sold by
Fnma
Bought by
Rhode Island Hsng & Mtg
Purchase Details
Closed on
Dec 11, 2008
Sold by
Velez Jose M
Bought by
Federal National Mortgage Association
Purchase Details
Closed on
Aug 6, 2001
Sold by
Delacruz Luz
Bought by
Velez Jose M
Purchase Details
Closed on
Jan 31, 2001
Sold by
C Lab Associates
Bought by
Delacruz Luz
Create a Home Valuation Report for This Property
The Home Valuation Report is an in-depth analysis detailing your home's value as well as a comparison with similar homes in the area
Home Values in the Area
Average Home Value in this Area
Purchase History
| Date | Buyer | Sale Price | Title Company |
|---|---|---|---|
| Hoff Priscilla L | $109,000 | -- | |
| Rhode Island Hsng & Mtg | $47,900 | -- | |
| Federal National Mortgage Association | $250,435 | -- | |
| Velez Jose M | $76,000 | -- | |
| Delacruz Luz | $55,000 | -- |
Source: Public Records
Mortgage History
| Date | Status | Borrower | Loan Amount |
|---|---|---|---|
| Open | Hoff Priscilla L | $104,000 | |
| Closed | Delacruz Luz | $2,500 | |
| Previous Owner | Delacruz Luz | $47,900 |
Source: Public Records
Tax History Compared to Growth
Tax History
| Year | Tax Paid | Tax Assessment Tax Assessment Total Assessment is a certain percentage of the fair market value that is determined by local assessors to be the total taxable value of land and additions on the property. | Land | Improvement |
|---|---|---|---|---|
| 2025 | $2,675 | $318,500 | $119,100 | $199,400 |
| 2024 | $4,246 | $231,400 | $75,400 | $156,000 |
| 2023 | $4,246 | $231,400 | $75,400 | $156,000 |
| 2022 | $4,119 | $231,400 | $75,400 | $156,000 |
| 2021 | $3,419 | $139,200 | $33,300 | $105,900 |
| 2020 | $3,419 | $139,200 | $33,300 | $105,900 |
| 2019 | $3,419 | $139,200 | $33,300 | $105,900 |
| 2018 | $3,749 | $117,300 | $30,200 | $87,100 |
| 2017 | $3,749 | $117,300 | $30,200 | $87,100 |
| 2016 | $3,749 | $117,300 | $30,200 | $87,100 |
| 2015 | $3,585 | $108,300 | $30,200 | $78,100 |
| 2014 | $3,655 | $108,300 | $30,200 | $78,100 |
| 2013 | $3,122 | $92,500 | $30,200 | $62,300 |
Source: Public Records
Map
Nearby Homes
- 35 Burnside St
- 43 Burnside St
- 20 Reynolds Ave
- 24 Reynolds Ave
- 38 Burnside St
- 28 Reynolds Ave
- 32 Burnside St
- 36 Reynolds Ave
- 142 Potters Ave
- 32 Reynolds Ave
- 32 Reynolds Ave Unit 1
- 32 Reynolds Ave Unit 3
- 32 Reynolds Ave Unit 2
- 144 Potters Ave
- 129 Potters Ave
- 52 Burnside St Unit 2
- 23 Reynolds St
- 50 Burnside St Unit 3
- 50 Burnside St Unit 2
- 51 Burnside St