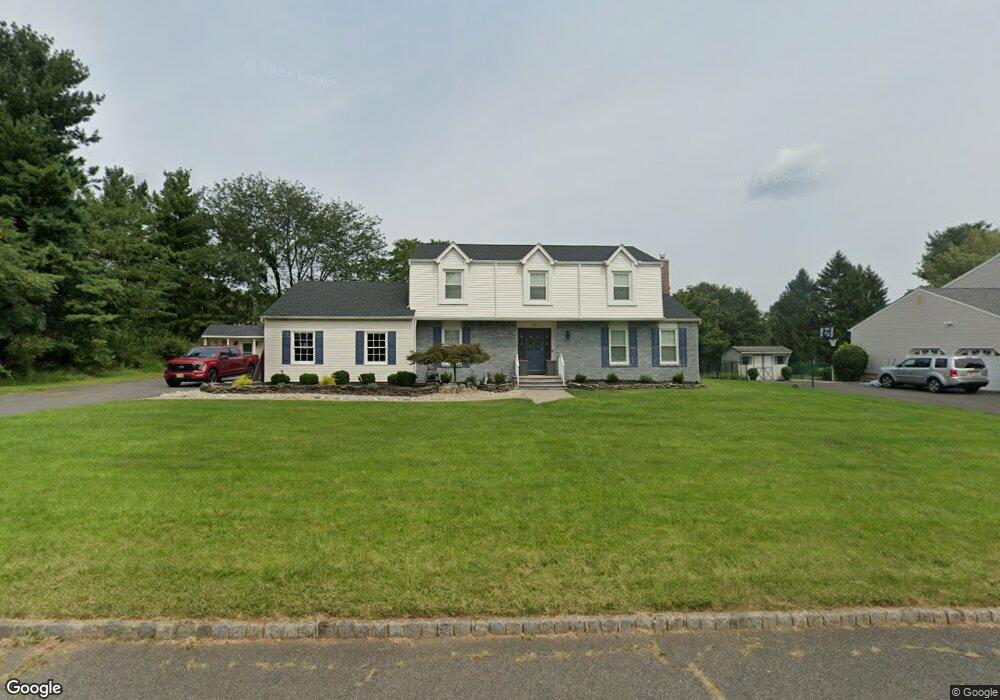
39 Camden Rd Hillsborough, NJ 08844
Estimated Value: $772,000 - $825,521
4
Beds
3
Baths
2,415
Sq Ft
$335/Sq Ft
Est. Value
About This Home
This home is located at 39 Camden Rd, Hillsborough, NJ 08844 and is currently estimated at $808,380, approximately $334 per square foot. 39 Camden Rd is a home located in Somerset County with nearby schools including Hillsborough High School.
Ownership History
Date
Name
Owned For
Owner Type
Purchase Details
Closed on
Jul 8, 2020
Sold by
Ragab Ashraf and Ragab Sherein
Bought by
Massad Paul A and Massad Dora T
Current Estimated Value
Home Financials for this Owner
Home Financials are based on the most recent Mortgage that was taken out on this home.
Original Mortgage
$422,750
Outstanding Balance
$374,867
Interest Rate
3.1%
Mortgage Type
New Conventional
Estimated Equity
$433,513
Purchase Details
Closed on
Sep 16, 2004
Sold by
Lubas Thomas J
Bought by
Ragab Ashraf and Ragab Sherein
Home Financials for this Owner
Home Financials are based on the most recent Mortgage that was taken out on this home.
Original Mortgage
$331,000
Interest Rate
5.89%
Create a Home Valuation Report for This Property
The Home Valuation Report is an in-depth analysis detailing your home's value as well as a comparison with similar homes in the area
Home Values in the Area
Average Home Value in this Area
Purchase History
| Date | Buyer | Sale Price | Title Company |
|---|---|---|---|
| Massad Paul A | $445,000 | Premier Abstract And Ttl Inc | |
| Ragab Ashraf | $456,000 | -- |
Source: Public Records
Mortgage History
| Date | Status | Borrower | Loan Amount |
|---|---|---|---|
| Open | Massad Paul A | $422,750 | |
| Previous Owner | Ragab Ashraf | $331,000 |
Source: Public Records
Tax History Compared to Growth
Tax History
| Year | Tax Paid | Tax Assessment Tax Assessment Total Assessment is a certain percentage of the fair market value that is determined by local assessors to be the total taxable value of land and additions on the property. | Land | Improvement |
|---|---|---|---|---|
| 2025 | $12,978 | $661,700 | $360,200 | $301,500 |
| 2024 | $12,978 | $605,600 | $340,200 | $265,400 |
| 2023 | $11,710 | $543,900 | $305,200 | $238,700 |
| 2022 | $11,281 | $505,200 | $295,200 | $210,000 |
| 2021 | $10,953 | $466,500 | $250,200 | $216,300 |
| 2020 | $11,448 | $480,200 | $245,200 | $235,000 |
| 2019 | $11,409 | $474,600 | $230,200 | $244,400 |
| 2018 | $11,437 | $472,800 | $220,200 | $252,600 |
| 2017 | $11,017 | $456,200 | $200,200 | $256,000 |
| 2016 | $10,402 | $430,900 | $165,200 | $265,700 |
| 2015 | $10,332 | $433,400 | $165,200 | $268,200 |
| 2014 | $9,441 | $404,500 | $165,200 | $239,300 |
Source: Public Records
Map
Nearby Homes