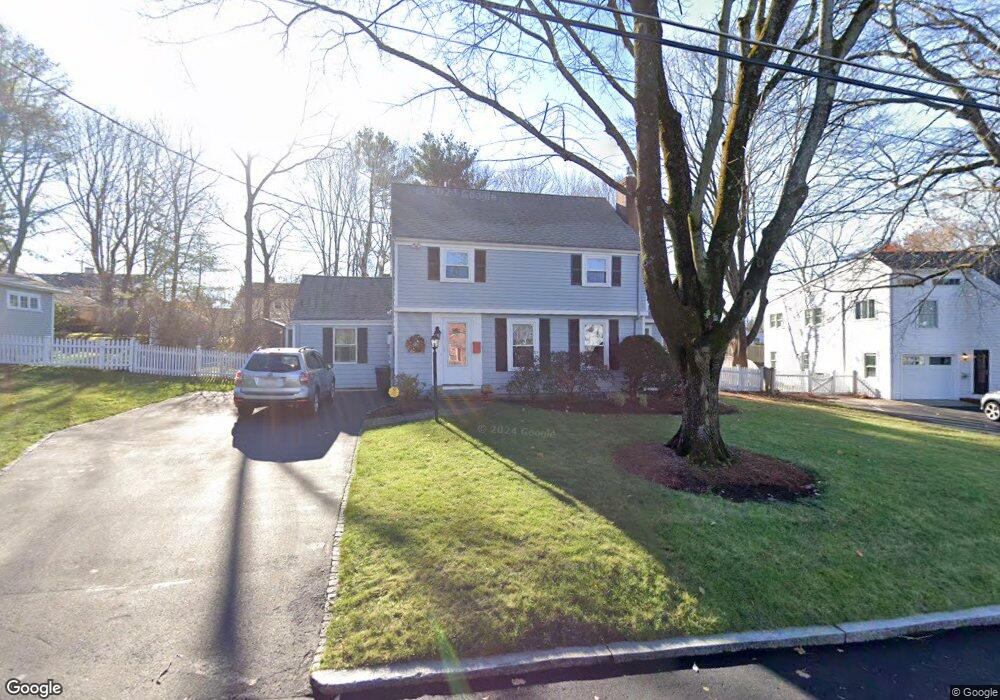
39 Canterbury Rd Winchester, MA 01890
Grove Street NeighborhoodEstimated Value: $1,219,000 - $1,361,039
3
Beds
2
Baths
2,203
Sq Ft
$593/Sq Ft
Est. Value
About This Home
This home is located at 39 Canterbury Rd, Winchester, MA 01890 and is currently estimated at $1,306,260, approximately $592 per square foot. 39 Canterbury Rd is a home located in Middlesex County with nearby schools including Ambrose Elementary School, McCall Middle School, and Winchester High School.
Ownership History
Date
Name
Owned For
Owner Type
Purchase Details
Closed on
Jan 13, 2014
Sold by
Bartol Linda M
Bought by
Linda M Bartol Ft
Current Estimated Value
Purchase Details
Closed on
May 28, 1974
Bought by
Linda Bartol Ft
Create a Home Valuation Report for This Property
The Home Valuation Report is an in-depth analysis detailing your home's value as well as a comparison with similar homes in the area
Home Values in the Area
Average Home Value in this Area
Purchase History
| Date | Buyer | Sale Price | Title Company |
|---|---|---|---|
| Linda M Bartol Ft | -- | -- | |
| Linda Bartol Ft | -- | -- |
Source: Public Records
Mortgage History
| Date | Status | Borrower | Loan Amount |
|---|---|---|---|
| Previous Owner | Linda Bartol Ft | $28,000 | |
| Previous Owner | Linda Bartol Ft | $17,000 |
Source: Public Records
Tax History Compared to Growth
Tax History
| Year | Tax Paid | Tax Assessment Tax Assessment Total Assessment is a certain percentage of the fair market value that is determined by local assessors to be the total taxable value of land and additions on the property. | Land | Improvement |
|---|---|---|---|---|
| 2025 | $139 | $1,255,600 | $844,600 | $411,000 |
| 2024 | $13,865 | $1,223,700 | $844,600 | $379,100 |
| 2023 | $13,136 | $1,113,200 | $743,300 | $369,900 |
| 2022 | $12,830 | $1,025,600 | $675,700 | $349,900 |
| 2021 | $12,291 | $958,000 | $608,100 | $349,900 |
| 2020 | $7,833 | $958,000 | $608,100 | $349,900 |
| 2019 | $7,702 | $890,500 | $540,600 | $349,900 |
| 2018 | $9,926 | $814,300 | $488,200 | $326,100 |
| 2017 | $7,238 | $725,800 | $419,800 | $306,000 |
| 2016 | $8,062 | $690,200 | $395,300 | $294,900 |
| 2015 | $8,232 | $678,100 | $395,300 | $282,800 |
| 2014 | $7,623 | $602,100 | $329,400 | $272,700 |
Source: Public Records
Map
Nearby Homes
- 41 Canterbury Rd
- 106 Norwich Cir
- 110 Norwich Cir
- 37 Canterbury Rd
- 102 Norwich Cir
- 114 Norwich Cir
- 32 Canterbury Rd
- 40 Canterbury Rd
- 43 Canterbury Rd
- 35 Canterbury Rd
- 118 Norwich Cir
- 98 Norwich Cir
- 107 Norwich Cir
- 105 Norwich Cir
- 42 Canterbury Rd
- 33 Canterbury Rd
- 109 Norwich Cir
- 122 Norwich Cir
- 93 Norwich Cir
- 28 Canterbury Rd