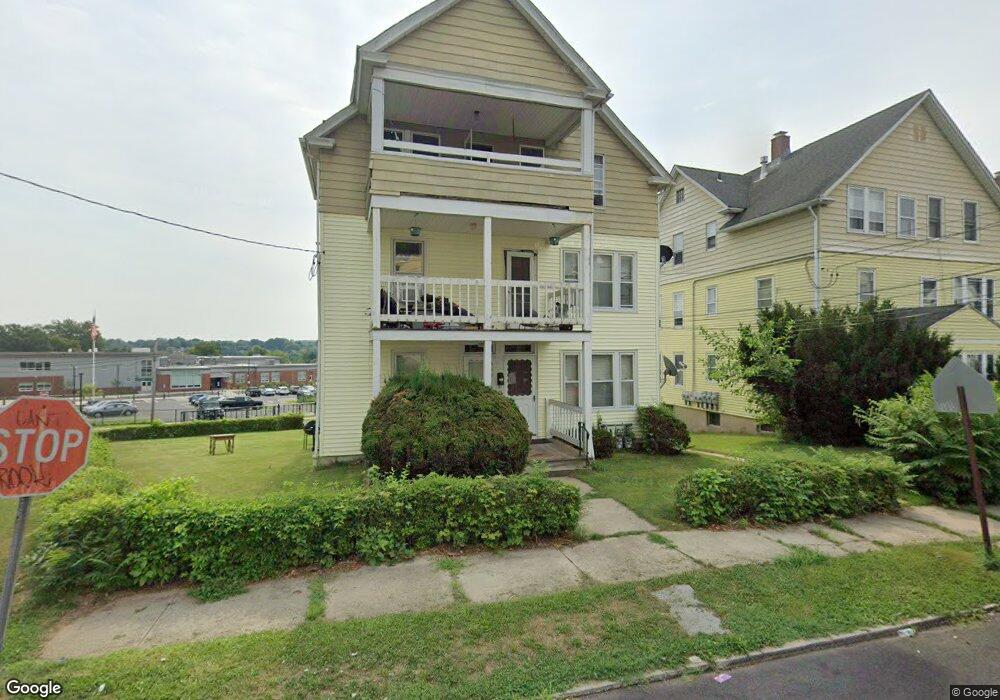
39 Carlson St New Britain, CT 06051
Estimated Value: $388,000 - $479,000
9
Beds
3
Baths
3,420
Sq Ft
$130/Sq Ft
Est. Value
About This Home
This home is located at 39 Carlson St, New Britain, CT 06051 and is currently estimated at $444,000, approximately $129 per square foot. 39 Carlson St is a home located in Hartford County with nearby schools including Chamberlain School, Pulaski Middle School, and Emmanuel Christian Academy.
Ownership History
Date
Name
Owned For
Owner Type
Purchase Details
Closed on
May 4, 2015
Sold by
Hsbc Bank Usa Na
Bought by
Webb Earl and Gordon-Webb Jacqueline
Current Estimated Value
Home Financials for this Owner
Home Financials are based on the most recent Mortgage that was taken out on this home.
Original Mortgage
$171,830
Outstanding Balance
$127,759
Interest Rate
2.75%
Mortgage Type
FHA
Estimated Equity
$316,241
Purchase Details
Closed on
Nov 6, 2014
Sold by
Meggie Shawn D
Bought by
Hsbc Bank Usa Na
Purchase Details
Closed on
May 4, 2007
Sold by
Negro Amalia M and Negro Richard D
Bought by
Meggie Shawn D
Home Financials for this Owner
Home Financials are based on the most recent Mortgage that was taken out on this home.
Original Mortgage
$208,000
Interest Rate
6.23%
Create a Home Valuation Report for This Property
The Home Valuation Report is an in-depth analysis detailing your home's value as well as a comparison with similar homes in the area
Home Values in the Area
Average Home Value in this Area
Purchase History
| Date | Buyer | Sale Price | Title Company |
|---|---|---|---|
| Webb Earl | $175,000 | -- | |
| Hsbc Bank Usa Na | -- | -- | |
| Meggie Shawn D | $260,000 | -- |
Source: Public Records
Mortgage History
| Date | Status | Borrower | Loan Amount |
|---|---|---|---|
| Open | Webb Earl | $171,830 | |
| Previous Owner | Meggie Shawn D | $208,000 | |
| Previous Owner | Meggie Shawn D | $38,000 | |
| Previous Owner | Meggie Shawn D | $25,000 |
Source: Public Records
Tax History Compared to Growth
Tax History
| Year | Tax Paid | Tax Assessment Tax Assessment Total Assessment is a certain percentage of the fair market value that is determined by local assessors to be the total taxable value of land and additions on the property. | Land | Improvement |
|---|---|---|---|---|
| 2025 | $8,828 | $225,330 | $44,800 | $180,530 |
| 2024 | $8,921 | $225,330 | $44,800 | $180,530 |
| 2023 | $8,626 | $225,330 | $44,800 | $180,530 |
| 2022 | $6,331 | $127,890 | $20,650 | $107,240 |
| 2021 | $6,331 | $127,890 | $20,650 | $107,240 |
| 2020 | $6,458 | $127,890 | $20,650 | $107,240 |
| 2019 | $6,458 | $127,890 | $20,650 | $107,240 |
| 2018 | $6,458 | $127,890 | $20,650 | $107,240 |
| 2017 | $6,094 | $120,680 | $20,650 | $100,030 |
| 2016 | $6,094 | $120,680 | $20,650 | $100,030 |
| 2015 | $5,913 | $120,680 | $20,650 | $100,030 |
| 2014 | -- | $120,680 | $20,650 | $100,030 |
Source: Public Records
Map
Nearby Homes