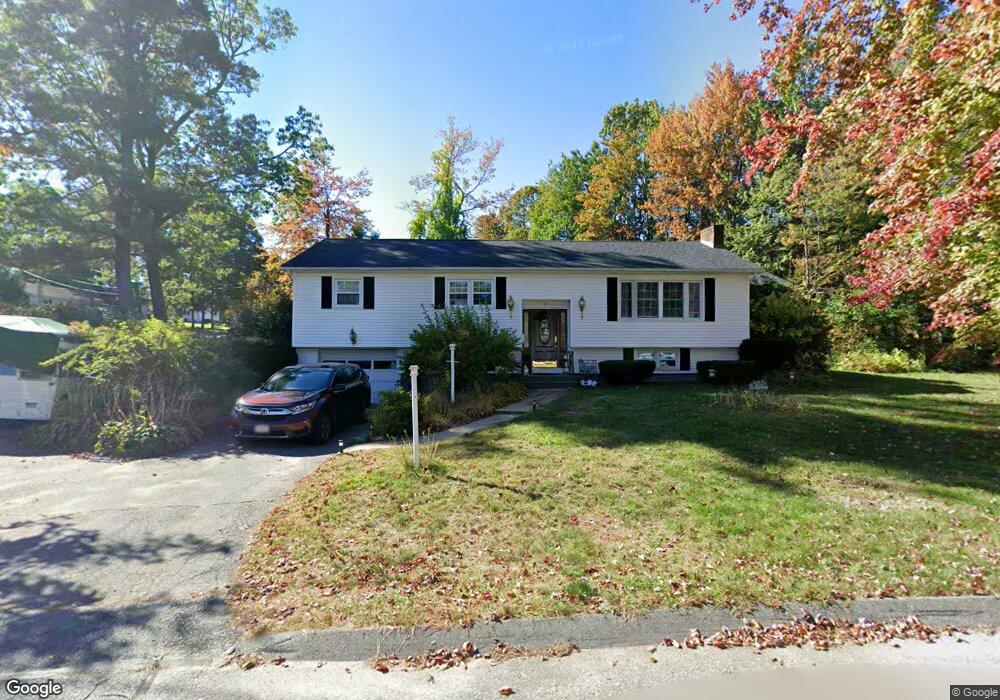
39 Chabot Dr Fitchburg, MA 01420
Estimated Value: $477,000 - $561,000
4
Beds
3
Baths
2,677
Sq Ft
$198/Sq Ft
Est. Value
About This Home
This home is located at 39 Chabot Dr, Fitchburg, MA 01420 and is currently estimated at $529,752, approximately $197 per square foot. 39 Chabot Dr is a home located in Worcester County with nearby schools including Reingold Elementary School, South Street Elementary School, and Crocker Elementary School.
Ownership History
Date
Name
Owned For
Owner Type
Purchase Details
Closed on
Nov 21, 2008
Sold by
Lafleur Grace C
Bought by
Galloway Gregory E and Loven-Galloway Tricia L
Current Estimated Value
Home Financials for this Owner
Home Financials are based on the most recent Mortgage that was taken out on this home.
Original Mortgage
$264,568
Interest Rate
6.03%
Mortgage Type
VA
Purchase Details
Closed on
Aug 13, 1997
Sold by
Frigoletto Joan M
Bought by
Lafleur Grace C
Create a Home Valuation Report for This Property
The Home Valuation Report is an in-depth analysis detailing your home's value as well as a comparison with similar homes in the area
Home Values in the Area
Average Home Value in this Area
Purchase History
| Date | Buyer | Sale Price | Title Company |
|---|---|---|---|
| Galloway Gregory E | $259,000 | -- | |
| Lafleur Grace C | $141,000 | -- |
Source: Public Records
Mortgage History
| Date | Status | Borrower | Loan Amount |
|---|---|---|---|
| Open | Lafleur Grace C | $271,120 | |
| Closed | Galloway Gregory E | $264,568 | |
| Previous Owner | Lafleur Grace C | $20,000 | |
| Previous Owner | Lafleur Grace C | $30,000 |
Source: Public Records
Tax History Compared to Growth
Tax History
| Year | Tax Paid | Tax Assessment Tax Assessment Total Assessment is a certain percentage of the fair market value that is determined by local assessors to be the total taxable value of land and additions on the property. | Land | Improvement |
|---|---|---|---|---|
| 2025 | $58 | $428,100 | $115,100 | $313,000 |
| 2024 | $5,923 | $399,900 | $83,300 | $316,600 |
| 2023 | $5,807 | $362,500 | $74,300 | $288,200 |
| 2022 | $5,512 | $313,000 | $73,000 | $240,000 |
| 2021 | $5,650 | $296,900 | $70,500 | $226,400 |
| 2020 | $5,546 | $281,400 | $69,200 | $212,200 |
| 2019 | $5,336 | $260,400 | $70,500 | $189,900 |
| 2018 | $5,084 | $242,000 | $65,300 | $176,700 |
| 2017 | $4,844 | $225,400 | $64,000 | $161,400 |
| 2016 | $4,533 | $213,500 | $58,900 | $154,600 |
| 2015 | $4,287 | $207,300 | $56,400 | $150,900 |
| 2014 | $4,182 | $210,900 | $56,400 | $154,500 |
Source: Public Records
Map
Nearby Homes
- 44 Bel Air Dr
- 36 Miles St
- 71 Belgian Way
- 53 Alice Ave
- 166 Caspian Way
- 48 Belgian Way
- 521 Rollstone Rd
- 83 Eleanor St
- 16 Caspian Way
- 0 Franklin Rd-Lots1-7 Unit 72947330
- 162 Delisle St
- 429 Oak Hill Rd
- 35 Bernadette St
- 189 Bridle Cross Rd
- 69 Bridle Cross Rd Unit 69
- 36 England Ave
- 48 Silver St
- 27 Clifton St
- 837 Mount Elam Rd
- 32 Clifton St