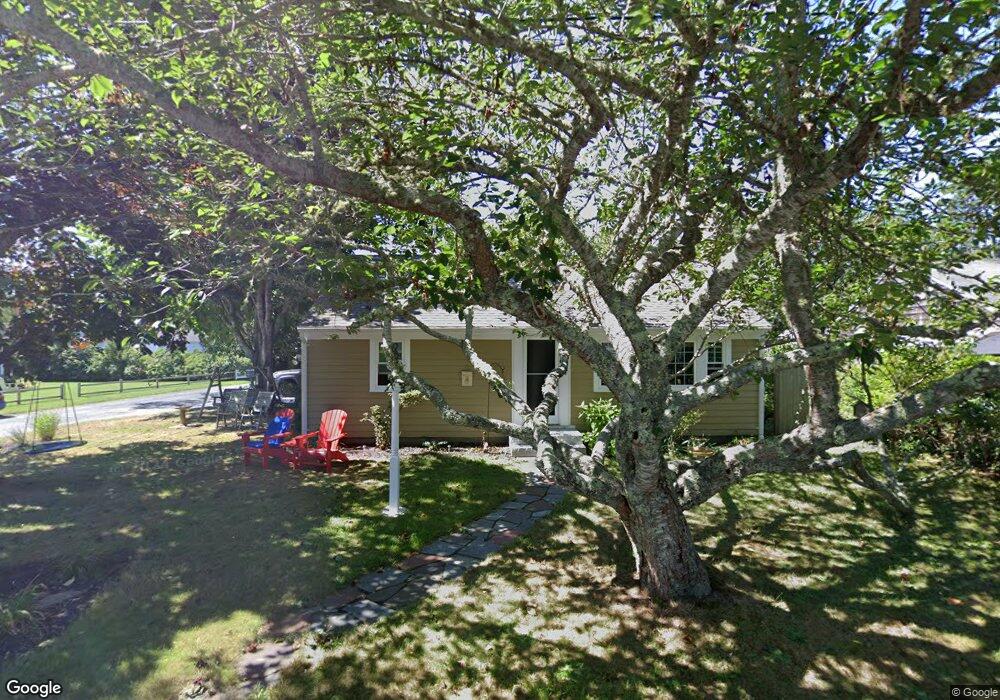
39 Chase St Dennis Port, MA 02639
Dennis Port NeighborhoodEstimated Value: $572,000 - $710,000
3
Beds
1
Bath
1,004
Sq Ft
$645/Sq Ft
Est. Value
About This Home
This home is located at 39 Chase St, Dennis Port, MA 02639 and is currently estimated at $647,485, approximately $644 per square foot. 39 Chase St is a home located in Barnstable County with nearby schools including Dennis-Yarmouth Regional High School and St. Pius X. School.
Ownership History
Date
Name
Owned For
Owner Type
Purchase Details
Closed on
Dec 15, 2006
Sold by
Zepf Marvin C
Bought by
Gallo Joseph Gary
Current Estimated Value
Home Financials for this Owner
Home Financials are based on the most recent Mortgage that was taken out on this home.
Original Mortgage
$100,000
Outstanding Balance
$59,788
Interest Rate
6.31%
Mortgage Type
Purchase Money Mortgage
Estimated Equity
$587,697
Purchase Details
Closed on
Jan 24, 2002
Sold by
Clifford Colleen B
Bought by
Zepf Marvin C and Zepf Norma J
Home Financials for this Owner
Home Financials are based on the most recent Mortgage that was taken out on this home.
Original Mortgage
$100,000
Interest Rate
7.08%
Mortgage Type
Purchase Money Mortgage
Purchase Details
Closed on
Apr 10, 1998
Sold by
Sahagian Edward H
Bought by
Buckley Colleen M
Home Financials for this Owner
Home Financials are based on the most recent Mortgage that was taken out on this home.
Original Mortgage
$100,342
Interest Rate
6.98%
Mortgage Type
Purchase Money Mortgage
Create a Home Valuation Report for This Property
The Home Valuation Report is an in-depth analysis detailing your home's value as well as a comparison with similar homes in the area
Home Values in the Area
Average Home Value in this Area
Purchase History
| Date | Buyer | Sale Price | Title Company |
|---|---|---|---|
| Gallo Joseph Gary | $100,000 | -- | |
| Zepf Marvin C | $185,000 | -- | |
| Buckley Colleen M | $101,000 | -- |
Source: Public Records
Mortgage History
| Date | Status | Borrower | Loan Amount |
|---|---|---|---|
| Open | Gallo Joseph Gary | $100,000 | |
| Previous Owner | Buckley Colleen M | $100,000 | |
| Previous Owner | Buckley Colleen M | $100,342 |
Source: Public Records
Tax History Compared to Growth
Tax History
| Year | Tax Paid | Tax Assessment Tax Assessment Total Assessment is a certain percentage of the fair market value that is determined by local assessors to be the total taxable value of land and additions on the property. | Land | Improvement |
|---|---|---|---|---|
| 2025 | $2,615 | $603,900 | $274,000 | $329,900 |
| 2024 | $2,472 | $563,000 | $263,500 | $299,500 |
| 2023 | $2,391 | $512,000 | $239,500 | $272,500 |
| 2022 | $2,095 | $374,100 | $188,800 | $185,300 |
| 2021 | $2,039 | $338,200 | $185,100 | $153,100 |
| 2020 | $1,975 | $323,800 | $185,100 | $138,700 |
| 2019 | $1,973 | $319,800 | $197,000 | $122,800 |
| 2018 | $1,826 | $288,000 | $187,600 | $100,400 |
| 2017 | $5,711 | $269,700 | $172,700 | $97,000 |
| 2016 | $1,592 | $243,800 | $162,900 | $80,900 |
| 2015 | $1,560 | $243,800 | $162,900 | $80,900 |
| 2014 | $1,485 | $233,900 | $153,000 | $80,900 |
Source: Public Records
Map
Nearby Homes
- 402 Old Wharf Rd
- 102 Sea St
- 402 Old Wharf Rd
- 11 Ocean Park W
- 405 Old Wharf Rd Unit B204
- 405 Old Wharf Rd Unit B204
- 9 Chase Ave Unit 6
- 26 Manning Rd
- 22 Ferncliff Rd
- 12 Cross St
- 159 Center St Unit 22
- 37-A Beach Hills Rd
- 1 E Belmont Unit 630
- 37 Beach Hills Rd
- 1 Belmont Rd Unit 630
- 1 Belmont Rd Unit 513
- 262 Old Wharf Rd Unit 67
- 262 Old Wharf Rd Unit 5
- 262 Old Wharf Rd Unit 5
- 262 Old Wharf Rd Unit 20