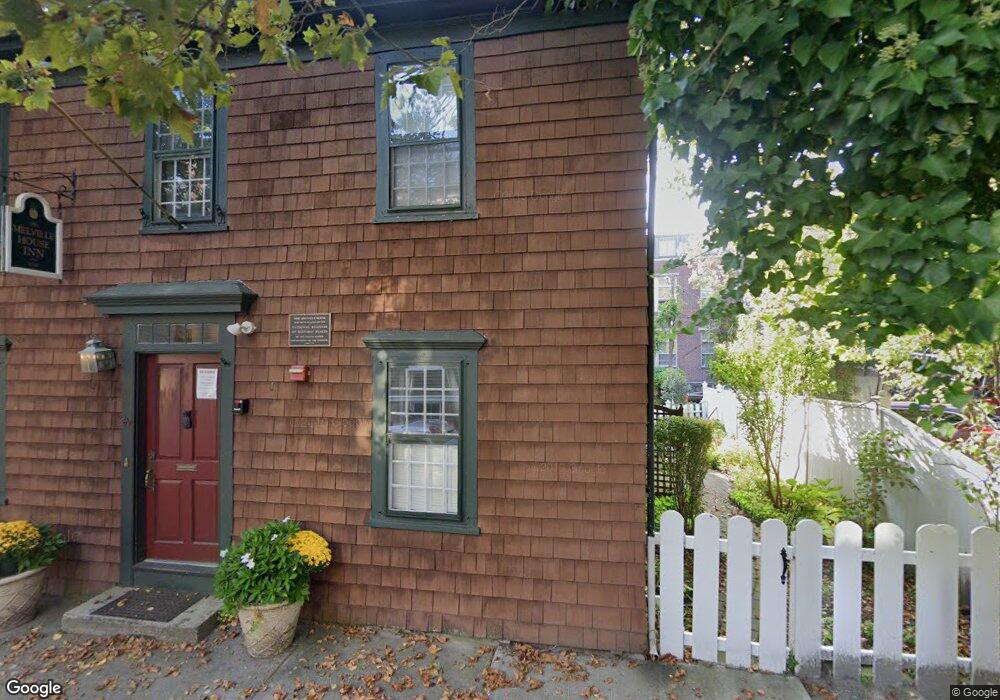
39 Clarke St Newport, RI 02840
Historic Hill NeighborhoodEstimated Value: $1,530,840
5
Beds
6
Baths
3,220
Sq Ft
$475/Sq Ft
Est. Value
About This Home
This home is located at 39 Clarke St, Newport, RI 02840 and is currently estimated at $1,530,840, approximately $475 per square foot. 39 Clarke St is a home located in Newport County with nearby schools including Rogers High School, St Michael's Country Day School, and St George's School.
Ownership History
Date
Name
Owned For
Owner Type
Purchase Details
Closed on
Apr 29, 2009
Sold by
Peretti Robert A and Peretti Priscilla
Bought by
Farrick Richard E
Current Estimated Value
Purchase Details
Closed on
Sep 18, 2002
Sold by
D H Ptnshp
Bought by
Peretti Robert A and Peretti Priscilla
Home Financials for this Owner
Home Financials are based on the most recent Mortgage that was taken out on this home.
Original Mortgage
$430,000
Interest Rate
6.36%
Mortgage Type
Commercial
Purchase Details
Closed on
May 18, 1993
Sold by
Rogers Samuel E and Rogers Rita
Bought by
Dh Ptnrshp
Home Financials for this Owner
Home Financials are based on the most recent Mortgage that was taken out on this home.
Original Mortgage
$265,000
Interest Rate
7.47%
Mortgage Type
Commercial
Create a Home Valuation Report for This Property
The Home Valuation Report is an in-depth analysis detailing your home's value as well as a comparison with similar homes in the area
Home Values in the Area
Average Home Value in this Area
Purchase History
| Date | Buyer | Sale Price | Title Company |
|---|---|---|---|
| Farrick Richard E | $635,000 | -- | |
| Farrick Richard E | $635,000 | -- | |
| Peretti Robert A | $600,000 | -- | |
| Peretti Robert A | $600,000 | -- | |
| Dh Ptnrshp | $295,000 | -- |
Source: Public Records
Mortgage History
| Date | Status | Borrower | Loan Amount |
|---|---|---|---|
| Previous Owner | Dh Ptnrshp | $135,000 | |
| Previous Owner | Dh Ptnrshp | $430,000 | |
| Previous Owner | Dh Ptnrshp | $265,000 |
Source: Public Records
Tax History Compared to Growth
Tax History
| Year | Tax Paid | Tax Assessment Tax Assessment Total Assessment is a certain percentage of the fair market value that is determined by local assessors to be the total taxable value of land and additions on the property. | Land | Improvement |
|---|---|---|---|---|
| 2025 | $12,537 | $1,164,100 | $422,400 | $741,700 |
| 2024 | $12,175 | $1,164,000 | $422,400 | $741,600 |
| 2023 | $12,885 | $865,900 | $276,100 | $589,800 |
| 2022 | $12,478 | $865,900 | $276,100 | $589,800 |
| 2021 | $12,114 | $865,900 | $276,100 | $589,800 |
| 2020 | $14,384 | $932,800 | $245,900 | $686,900 |
| 2019 | $14,384 | $932,800 | $245,900 | $686,900 |
| 2018 | $13,973 | $932,800 | $245,900 | $686,900 |
| 2017 | $12,110 | $778,800 | $296,100 | $482,700 |
| 2016 | $11,807 | $778,800 | $296,100 | $482,700 |
| 2015 | $11,518 | $778,800 | $296,100 | $482,700 |
| 2014 | $11,644 | $696,400 | $296,100 | $400,300 |
Source: Public Records
Map
Nearby Homes
- 130 Spring St Unit 132
- 10 Barney St Unit 102
- 10 Barney St Unit 107
- 10 Barney St Unit 101
- 10 Barney St Unit U106
- 50 School St Unit 7
- 12 Mount Vernon St Unit 5
- 75 Pelham St Unit B
- 10 Bull St
- 31 Coddington St Unit 24
- 27 Soar Way
- 26 Franklin St
- 60 Prospect Hill St
- 34 Bull St
- 102 Broadway Unit 2B
- 23 Mann Ave Unit 4
- 33 Kay St
- 1 Pell St
- 42 Mann Ave
- 5 Pell St
- 26 Mary St
- 44 Clarke St
- 32 Clarke St
- 46 Clarke St
- 29 Mary St
- 99 Spring St Unit T1
- 99 Spring St Unit R2
- 99 Spring St Unit R1
- 99 Spring St Unit TH1
- 99 Spring St
- 99 Spring St Unit 2R
- 99 Spring St
- 95 Spring St
- 20 Clarke St
- 41 Mary St
- 89 Spring St
- 87 Spring St
- 20 Mary St
- 16 Clarke St
- 94 Spring St Unit 96