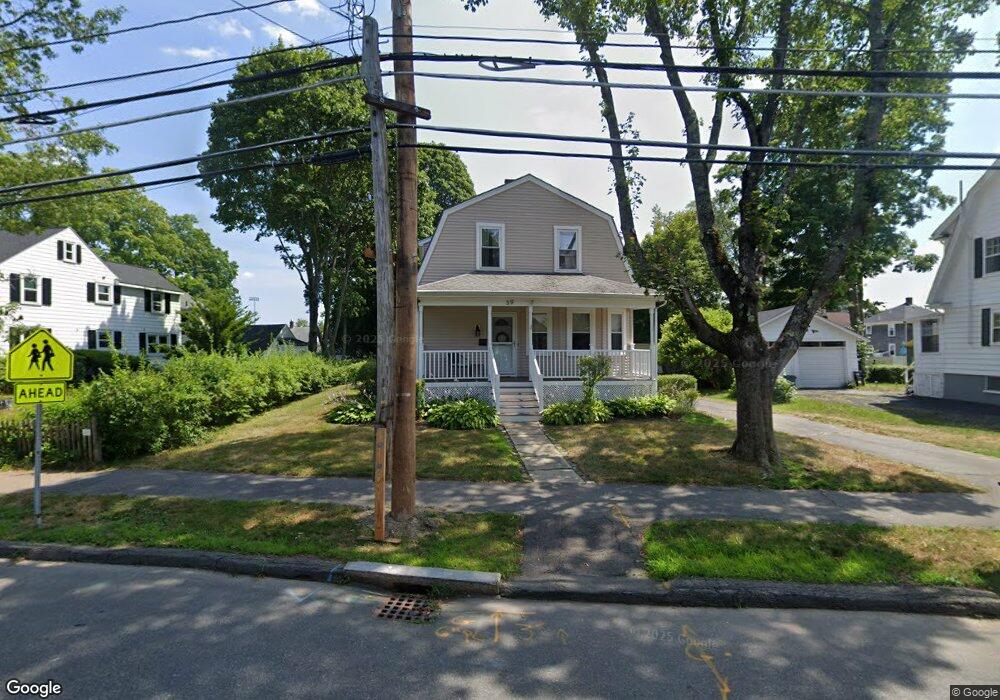
39 Conant St Danvers, MA 01923
Estimated Value: $733,000 - $800,000
3
Beds
3
Baths
2,264
Sq Ft
$332/Sq Ft
Est. Value
About This Home
This home is located at 39 Conant St, Danvers, MA 01923 and is currently estimated at $752,027, approximately $332 per square foot. 39 Conant St is a home located in Essex County with nearby schools including Danvers High School, St. Mary of the Annunciation School, and St. John's Prep.
Ownership History
Date
Name
Owned For
Owner Type
Purchase Details
Closed on
Nov 28, 2023
Sold by
Pendergast Janice L
Bought by
Janice L Pendergast Ret and Pendergast
Current Estimated Value
Purchase Details
Closed on
Nov 2, 1987
Sold by
King John G
Bought by
Pendergast Janice L
Create a Home Valuation Report for This Property
The Home Valuation Report is an in-depth analysis detailing your home's value as well as a comparison with similar homes in the area
Home Values in the Area
Average Home Value in this Area
Purchase History
| Date | Buyer | Sale Price | Title Company |
|---|---|---|---|
| Janice L Pendergast Ret | -- | None Available | |
| Pendergast Janice L | $174,500 | -- |
Source: Public Records
Mortgage History
| Date | Status | Borrower | Loan Amount |
|---|---|---|---|
| Previous Owner | Pendergast Janice L | $187,000 | |
| Previous Owner | Pendergast Janice L | $229,000 | |
| Previous Owner | Pendergast Janice L | $50,000 |
Source: Public Records
Map
Nearby Homes
- 14 Chase St
- 14 Grove St
- 35 High St Unit 3D
- 35 Locust St Unit 3
- 2 Chapel Rd
- 7 Riverbank Ave Unit 7
- 11 Riverside Ave Unit 111
- 34 Bayview Terrace Unit 5
- 5 Holten St
- 22 Maple Ave
- 6 Venice St Unit B3
- 43 Hobart St Unit B
- 14 Williams St Unit C17
- 55 Burley St
- 147 High St
- 108 Abington Rd Unit 108
- 63 Adams St
- 10 Clark St
- 97 Sylvan St Unit 7
- 76 Water St
Your Personal Tour Guide
Ask me questions while you tour the home.