P
Seller's Agent in 2025
Pryor and Snow TEAM
Coldwell Banker / Kennon, Parker, Duncan & Davis
(706) 256-1000
3 in this area
167 Total Sales
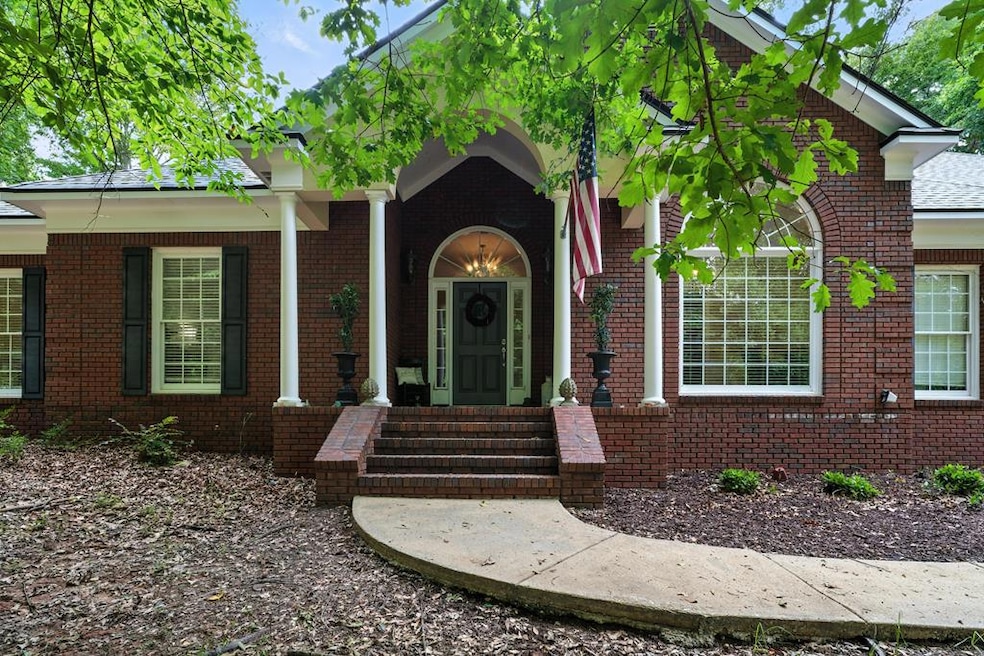

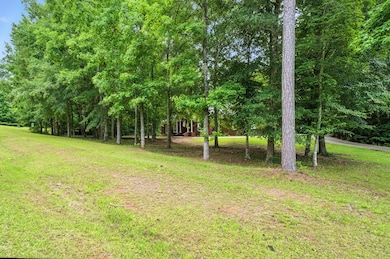
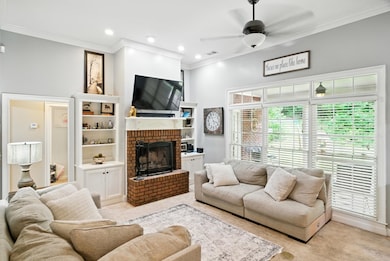
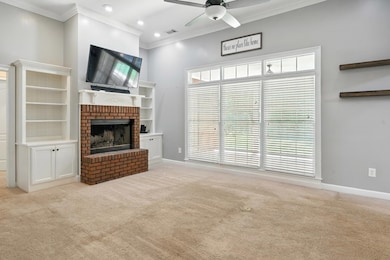
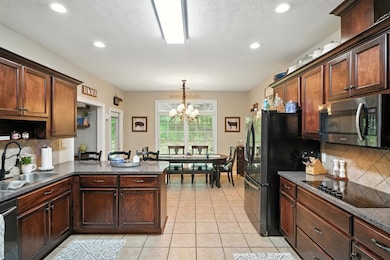
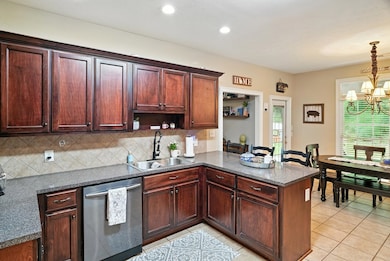
Looking for space, privacy, and lake life? This 4-bed, 2.5-bath home sits on a quiet, wooded 1-acre lot with access to beautiful Lake Harding. Inside, there's plenty of room to spread out, and outside, you'll love the peaceful vibe and natural surroundings. It's the perfect spot to relax, unwind, and enjoy life in Harris County. Seller offering $5,000 in concessions with acceptable offer.
Last Agent to Sell the Property
Coldwell Banker / Kennon, Parker, Duncan & Davis Brokerage Phone: 7062561000 Listed on: 07/07/2025

| Date | Type | Sale Price | Title Company |
|---|---|---|---|
| Warranty Deed | $217,000 | -- | |
| Foreclosure Deed | $183,300 | -- | |
| Deed | $300,000 | -- | |
| Deed | $226,500 | -- | |
| Deed | $32,500 | -- |
| Date | Status | Loan Amount | Loan Type |
|---|---|---|---|
| Open | $219,191 | New Conventional | |
| Previous Owner | $299,900 | New Conventional |
| Date | Event | Price | List to Sale | Price per Sq Ft |
|---|---|---|---|---|
| 11/07/2025 11/07/25 | Sold | $346,500 | -0.7% | $142 / Sq Ft |
| 09/29/2025 09/29/25 | Pending | -- | -- | -- |
| 09/23/2025 09/23/25 | For Sale | $349,000 | 0.0% | $143 / Sq Ft |
| 09/17/2025 09/17/25 | Pending | -- | -- | -- |
| 08/07/2025 08/07/25 | Price Changed | $349,000 | -2.8% | $143 / Sq Ft |
| 07/22/2025 07/22/25 | Price Changed | $359,000 | -1.6% | $148 / Sq Ft |
| 07/07/2025 07/07/25 | For Sale | $365,000 | -- | $150 / Sq Ft |
| Year | Tax Paid | Tax Assessment Tax Assessment Total Assessment is a certain percentage of the fair market value that is determined by local assessors to be the total taxable value of land and additions on the property. | Land | Improvement |
|---|---|---|---|---|
| 2025 | $3,310 | $116,705 | $14,000 | $102,705 |
| 2024 | $3,087 | $114,175 | $14,000 | $100,175 |
| 2023 | $2,384 | $105,085 | $14,000 | $91,085 |
| 2022 | $2,845 | $105,085 | $14,000 | $91,085 |
| 2021 | $2,850 | $101,588 | $14,000 | $87,588 |
| 2020 | $2,850 | $101,588 | $14,000 | $87,588 |
| 2019 | $2,749 | $101,588 | $14,000 | $87,588 |
| 2018 | $2,690 | $97,343 | $14,000 | $83,343 |
| 2017 | $2,404 | $97,343 | $14,000 | $83,343 |
| 2016 | $2,448 | $93,066 | $16,000 | $77,066 |
| 2015 | $2,356 | $89,183 | $16,000 | $73,183 |
| 2014 | $2,361 | $89,183 | $16,000 | $73,183 |
| 2013 | -- | $92,546 | $16,000 | $76,546 |
P
Seller's Agent in 2025
Pryor and Snow TEAM
Coldwell Banker / Kennon, Parker, Duncan & Davis
(706) 256-1000
3 in this area
167 Total Sales
Buyer's Agent in 2025
Jenni Applegate
Coldwell Banker / Kennon, Parker, Duncan & Davis
(740) 777-7745
1 in this area
39 Total Sales
Source: Columbus Board of REALTORS® (GA)
MLS Number: 222076
APN: 017-098
Disclaimer: Certain information contained herein is derived from information provided by parties other than Homes.com. All information provided is deemed reliable, but is not guaranteed to be accurate and should be independently verified.
![]() IDX information is provided exclusively for personal, non-commercial use, and may not be used for any purpose other than to identify prospective properties consumers may be interested in purchasing. Information is deemed reliable but not guaranteed.
IDX information is provided exclusively for personal, non-commercial use, and may not be used for any purpose other than to identify prospective properties consumers may be interested in purchasing. Information is deemed reliable but not guaranteed.