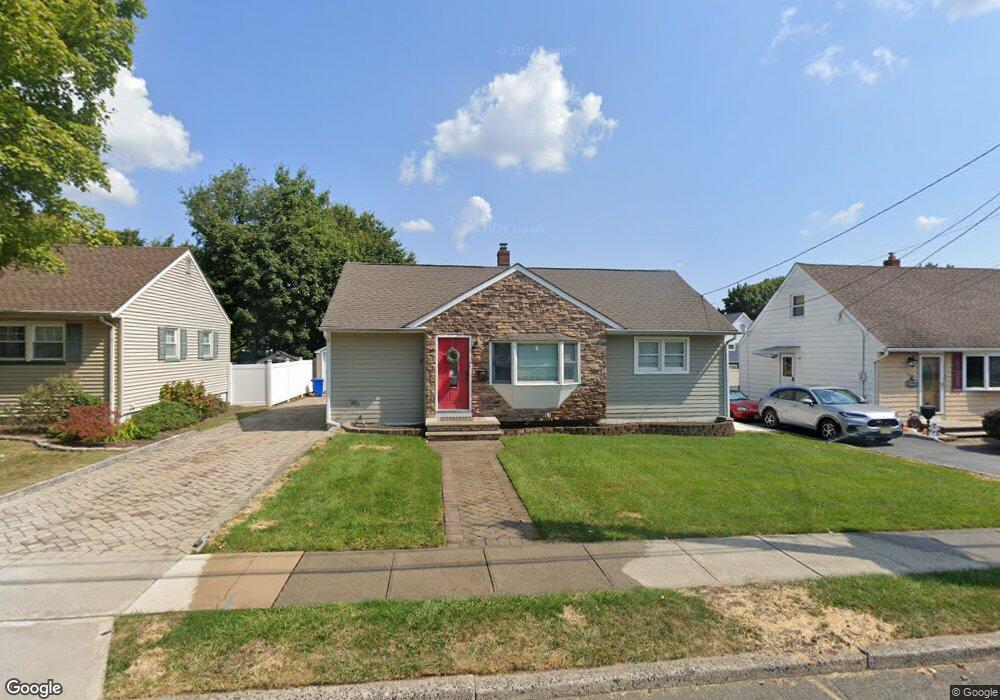
39 Craig Place Bloomfield, NJ 07003
Estimated Value: $621,000 - $689,000
--
Bed
--
Bath
1,137
Sq Ft
$563/Sq Ft
Est. Value
About This Home
This home is located at 39 Craig Place, Bloomfield, NJ 07003 and is currently estimated at $640,125, approximately $562 per square foot. 39 Craig Place is a home located in Essex County with nearby schools including Oak View School, Bloomfield Middle School, and Bloomfield High School.
Ownership History
Date
Name
Owned For
Owner Type
Purchase Details
Closed on
Jul 14, 2022
Sold by
Gomez Jose A and Gomez Janet
Bought by
Alonzo Roberto M and Alonzo Cila
Current Estimated Value
Home Financials for this Owner
Home Financials are based on the most recent Mortgage that was taken out on this home.
Original Mortgage
$432,437
Outstanding Balance
$411,909
Interest Rate
5.23%
Mortgage Type
New Conventional
Estimated Equity
$228,216
Purchase Details
Closed on
Sep 20, 2011
Sold by
Nelson Eric
Bought by
Gomez Jose A and Gomez Janet
Home Financials for this Owner
Home Financials are based on the most recent Mortgage that was taken out on this home.
Original Mortgage
$315,786
Interest Rate
4.87%
Mortgage Type
FHA
Purchase Details
Closed on
Nov 20, 2001
Sold by
Zaltsman Vladmimir
Bought by
Nelson Eric
Home Financials for this Owner
Home Financials are based on the most recent Mortgage that was taken out on this home.
Original Mortgage
$206,045
Interest Rate
6.72%
Mortgage Type
FHA
Create a Home Valuation Report for This Property
The Home Valuation Report is an in-depth analysis detailing your home's value as well as a comparison with similar homes in the area
Home Values in the Area
Average Home Value in this Area
Purchase History
| Date | Buyer | Sale Price | Title Company |
|---|---|---|---|
| Alonzo Roberto M | $470,000 | Weichert Title | |
| Gomez Jose A | $324,000 | Mega Title Llc | |
| Nelson Eric | $220,000 | -- |
Source: Public Records
Mortgage History
| Date | Status | Borrower | Loan Amount |
|---|---|---|---|
| Open | Alonzo Roberto M | $432,437 | |
| Previous Owner | Gomez Jose A | $315,786 | |
| Previous Owner | Nelson Eric | $206,045 |
Source: Public Records
Tax History Compared to Growth
Tax History
| Year | Tax Paid | Tax Assessment Tax Assessment Total Assessment is a certain percentage of the fair market value that is determined by local assessors to be the total taxable value of land and additions on the property. | Land | Improvement |
|---|---|---|---|---|
| 2025 | $13,180 | $403,300 | $193,800 | $209,500 |
| 2024 | $13,180 | $403,300 | $193,800 | $209,500 |
| 2022 | $12,914 | $403,300 | $193,800 | $209,500 |
| 2021 | $12,676 | $403,300 | $193,800 | $209,500 |
| 2020 | $12,482 | $403,300 | $193,800 | $209,500 |
| 2019 | $12,867 | $323,200 | $182,000 | $141,200 |
| 2018 | $12,812 | $323,200 | $182,000 | $141,200 |
| 2017 | $12,618 | $323,200 | $182,000 | $141,200 |
| 2016 | $12,476 | $323,200 | $182,000 | $141,200 |
| 2015 | $12,362 | $323,200 | $182,000 | $141,200 |
| 2014 | $12,136 | $323,200 | $182,000 | $141,200 |
Source: Public Records
Map
Nearby Homes