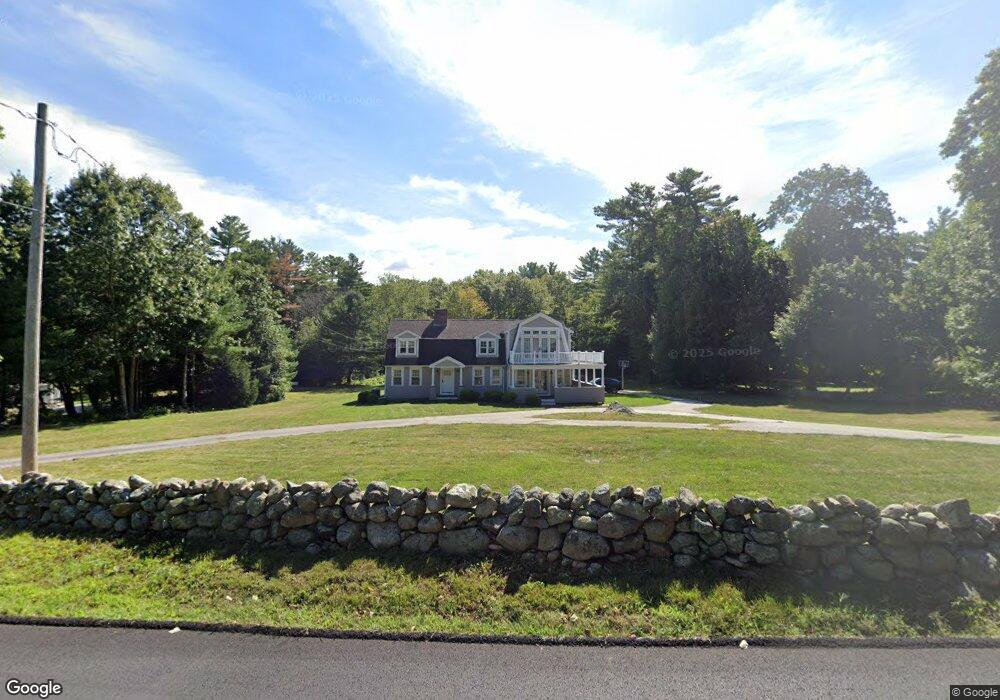
39 Cross St Norwell, MA 02061
Estimated Value: $1,140,000 - $1,382,000
3
Beds
2
Baths
1,877
Sq Ft
$674/Sq Ft
Est. Value
About This Home
This home is located at 39 Cross St, Norwell, MA 02061 and is currently estimated at $1,265,809, approximately $674 per square foot. 39 Cross St is a home located in Plymouth County with nearby schools including William Gould Vinal, Norwell Middle School, and Norwell High School.
Ownership History
Date
Name
Owned For
Owner Type
Purchase Details
Closed on
Feb 29, 2000
Sold by
Kiley Paul J and Kiley Rebecca B
Bought by
Alcaro Joseph A and Guarducci Veronica
Current Estimated Value
Purchase Details
Closed on
Jun 30, 1997
Sold by
Kirby William T and Kirby Denise L
Bought by
Kiley Paul J and Kiley Rebecca B
Create a Home Valuation Report for This Property
The Home Valuation Report is an in-depth analysis detailing your home's value as well as a comparison with similar homes in the area
Home Values in the Area
Average Home Value in this Area
Purchase History
| Date | Buyer | Sale Price | Title Company |
|---|---|---|---|
| Alcaro Joseph A | $317,000 | -- | |
| Alcaro Joseph A | $317,000 | -- | |
| Kiley Paul J | $214,900 | -- | |
| Kiley Paul J | $214,900 | -- |
Source: Public Records
Mortgage History
| Date | Status | Borrower | Loan Amount |
|---|---|---|---|
| Open | Kiley Paul J | $417,000 |
Source: Public Records
Tax History
| Year | Tax Paid | Tax Assessment Tax Assessment Total Assessment is a certain percentage of the fair market value that is determined by local assessors to be the total taxable value of land and additions on the property. | Land | Improvement |
|---|---|---|---|---|
| 2025 | $14,391 | $1,101,100 | $399,700 | $701,400 |
| 2024 | $13,780 | $1,023,800 | $377,200 | $646,600 |
| 2023 | $13,729 | $897,900 | $290,100 | $607,800 |
| 2022 | $13,143 | $790,800 | $252,600 | $538,200 |
| 2021 | $4,609 | $734,000 | $265,700 | $468,300 |
| 2020 | $3,644 | $716,100 | $265,700 | $450,400 |
| 2019 | $11,275 | $687,500 | $265,700 | $421,800 |
| 2018 | $10,943 | $669,700 | $265,700 | $404,000 |
| 2017 | $11,035 | $670,800 | $265,700 | $405,100 |
| 2016 | $10,689 | $647,800 | $265,700 | $382,100 |
| 2015 | $10,430 | $632,100 | $265,700 | $366,400 |
| 2014 | $9,609 | $587,000 | $264,700 | $322,300 |
Source: Public Records
Map
Nearby Homes
- 19 Dunster Ln
- 94 Old Oaken Bucket Rd
- 95 Stony Brook Ln
- 9 Cushing Park Rd
- 17 Old Oaken Bucket Rd
- 3 Harbor Ln
- 138 Judge Cushing Rd
- 3 Webster Farm Way
- 5 Webster Farm Way
- 25 Webster Farm Way
- 23 Webster Farm Way
- 48 Neal Gate St
- 98 Satuit Trail
- 19 Ford Place Unit 1
- 19 Ford Place Unit 2
- 2 Webster Farm Way
- 32 Carolyn Cir
- 14 Old Country Way Unit C
- 14 Old Country Way Unit B
- 293 Cross St
Your Personal Tour Guide
Ask me questions while you tour the home.