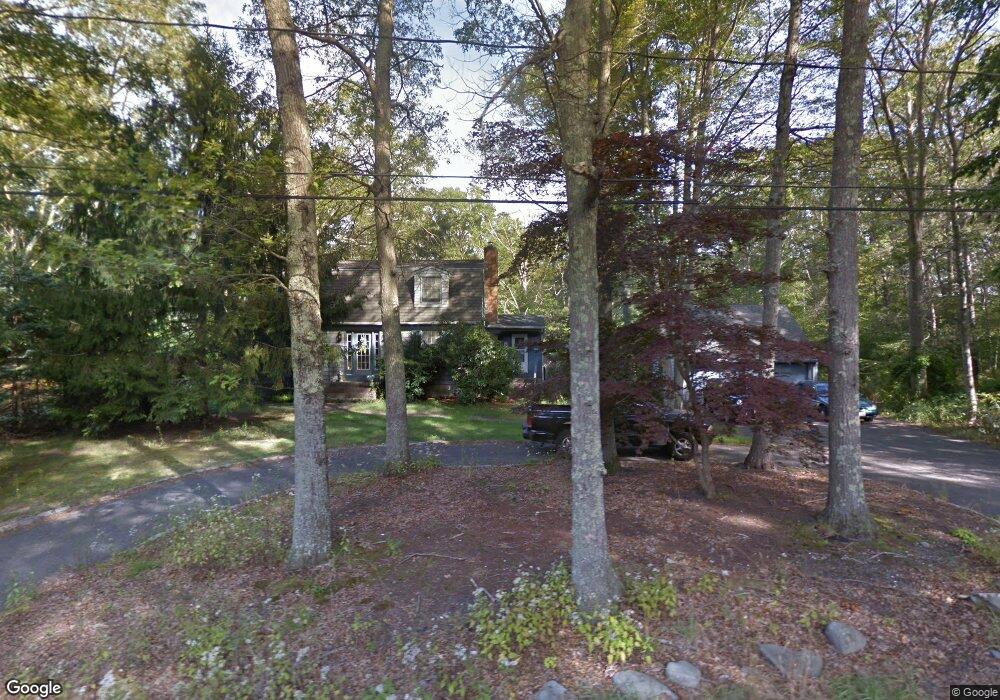
39 Cummings Rd Swansea, MA 02777
West Swansea NeighborhoodEstimated Value: $565,000 - $727,000
4
Beds
2
Baths
2,208
Sq Ft
$293/Sq Ft
Est. Value
About This Home
This home is located at 39 Cummings Rd, Swansea, MA 02777 and is currently estimated at $647,670, approximately $293 per square foot. 39 Cummings Rd is a home located in Bristol County with nearby schools including Joseph Case High School, SCEC Life Academy, and Swansea Wood School.
Ownership History
Date
Name
Owned For
Owner Type
Purchase Details
Closed on
Sep 27, 2016
Sold by
Walker-Gill Marilyn
Bought by
Gill John W
Current Estimated Value
Purchase Details
Closed on
Sep 19, 2006
Sold by
Gill John W
Bought by
Gill John W and Walker-Gill Marilyn
Purchase Details
Closed on
Mar 17, 2006
Sold by
Gill Debra and Gill John W
Bought by
Gill John W
Purchase Details
Closed on
Jan 11, 2001
Sold by
Boucher Edward C and Boucher Janice L
Bought by
Gilljr John W and Gill Debra
Home Financials for this Owner
Home Financials are based on the most recent Mortgage that was taken out on this home.
Original Mortgage
$207,000
Interest Rate
7.64%
Mortgage Type
Purchase Money Mortgage
Purchase Details
Closed on
Jun 23, 1989
Sold by
Dederer Edwin V
Bought by
Boucher Edward C
Create a Home Valuation Report for This Property
The Home Valuation Report is an in-depth analysis detailing your home's value as well as a comparison with similar homes in the area
Home Values in the Area
Average Home Value in this Area
Purchase History
| Date | Buyer | Sale Price | Title Company |
|---|---|---|---|
| Gill John W | -- | -- | |
| Gill John W | -- | -- | |
| Gill John W | -- | -- | |
| Gilljr John W | $230,000 | -- | |
| Boucher Edward C | $198,000 | -- |
Source: Public Records
Mortgage History
| Date | Status | Borrower | Loan Amount |
|---|---|---|---|
| Previous Owner | Boucher Edward C | $213,000 | |
| Previous Owner | Boucher Edward C | $207,000 | |
| Previous Owner | Boucher Edward C | $10,000 |
Source: Public Records
Tax History Compared to Growth
Tax History
| Year | Tax Paid | Tax Assessment Tax Assessment Total Assessment is a certain percentage of the fair market value that is determined by local assessors to be the total taxable value of land and additions on the property. | Land | Improvement |
|---|---|---|---|---|
| 2025 | $5,436 | $456,000 | $160,000 | $296,000 |
| 2024 | $5,503 | $459,000 | $160,000 | $299,000 |
| 2023 | $5,129 | $390,600 | $117,000 | $273,600 |
| 2022 | $4,798 | $333,400 | $106,400 | $227,000 |
| 2021 | $4,797 | $306,900 | $106,400 | $200,500 |
| 2020 | $4,341 | $278,600 | $106,400 | $172,200 |
| 2019 | $4,293 | $276,800 | $95,000 | $181,800 |
| 2018 | $4,170 | $272,900 | $93,000 | $179,900 |
| 2017 | $3,598 | $270,900 | $93,000 | $177,900 |
| 2016 | $3,456 | $255,600 | $80,400 | $175,200 |
| 2015 | $3,351 | $255,200 | $80,400 | $174,800 |
| 2014 | $3,116 | $242,700 | $80,400 | $162,300 |
Source: Public Records
Map
Nearby Homes