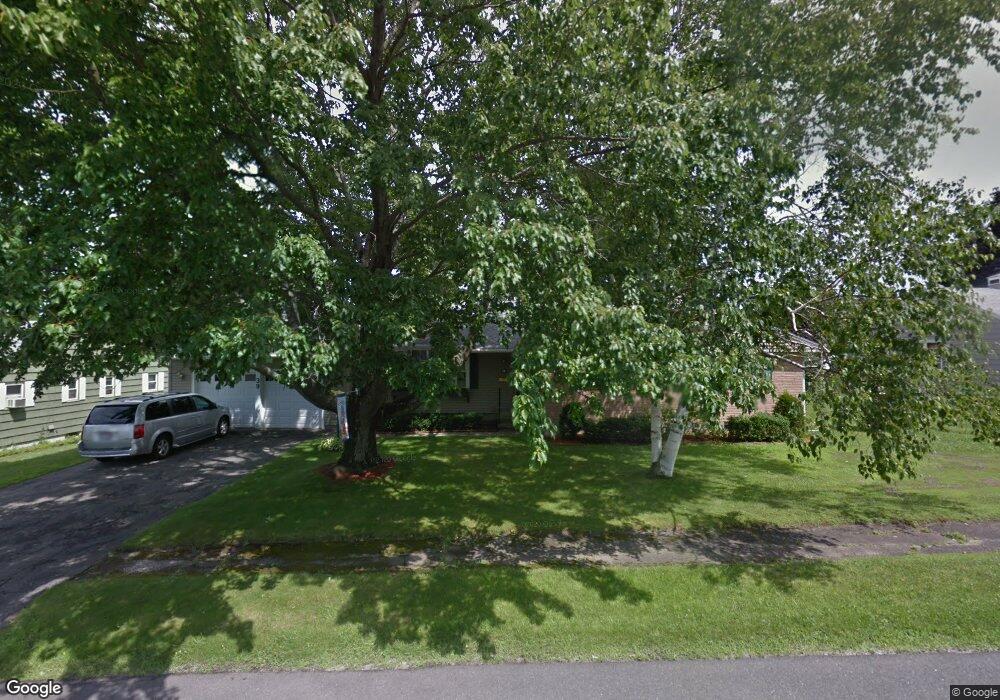
39 Dan Ave Pittsfield, MA 01201
Estimated Value: $364,000 - $419,000
4
Beds
3
Baths
1,790
Sq Ft
$224/Sq Ft
Est. Value
About This Home
This home is located at 39 Dan Ave, Pittsfield, MA 01201 and is currently estimated at $400,298, approximately $223 per square foot. 39 Dan Ave is a home located in Berkshire County with nearby schools including Williams Elementary School, Theodore Herberg Middle School, and Pittsfield High School.
Ownership History
Date
Name
Owned For
Owner Type
Purchase Details
Closed on
Sep 18, 2013
Sold by
Cusson Colvin F and Cusson Janice M
Bought by
Auge Marie A and Cusson Kevin
Current Estimated Value
Purchase Details
Closed on
Oct 23, 1992
Sold by
Lepisto Carroll Bruce
Bought by
Cusson Colvin F and Cusson Janice M
Home Financials for this Owner
Home Financials are based on the most recent Mortgage that was taken out on this home.
Original Mortgage
$11,000
Interest Rate
7.79%
Mortgage Type
Purchase Money Mortgage
Create a Home Valuation Report for This Property
The Home Valuation Report is an in-depth analysis detailing your home's value as well as a comparison with similar homes in the area
Home Values in the Area
Average Home Value in this Area
Purchase History
| Date | Buyer | Sale Price | Title Company |
|---|---|---|---|
| Auge Marie A | -- | -- | |
| Cusson Colvin F | $115,000 | -- |
Source: Public Records
Mortgage History
| Date | Status | Borrower | Loan Amount |
|---|---|---|---|
| Previous Owner | Cusson Colvin F | $11,000 |
Source: Public Records
Tax History
| Year | Tax Paid | Tax Assessment Tax Assessment Total Assessment is a certain percentage of the fair market value that is determined by local assessors to be the total taxable value of land and additions on the property. | Land | Improvement |
|---|---|---|---|---|
| 2025 | $6,566 | $366,000 | $80,500 | $285,500 |
| 2024 | $5,967 | $323,400 | $80,500 | $242,900 |
| 2023 | $5,584 | $304,800 | $80,500 | $224,300 |
| 2022 | $5,022 | $270,600 | $75,500 | $195,100 |
| 2021 | $4,716 | $245,000 | $75,500 | $169,500 |
| 2020 | $4,713 | $239,100 | $75,500 | $163,600 |
| 2019 | $4,480 | $230,700 | $70,500 | $160,200 |
| 2018 | $4,398 | $219,800 | $65,500 | $154,300 |
| 2017 | $4,199 | $213,900 | $65,500 | $148,400 |
| 2016 | $4,018 | $214,200 | $65,500 | $148,700 |
| 2015 | $3,868 | $214,200 | $65,500 | $148,700 |
Source: Public Records
Map
Nearby Homes
Your Personal Tour Guide
Ask me questions while you tour the home.