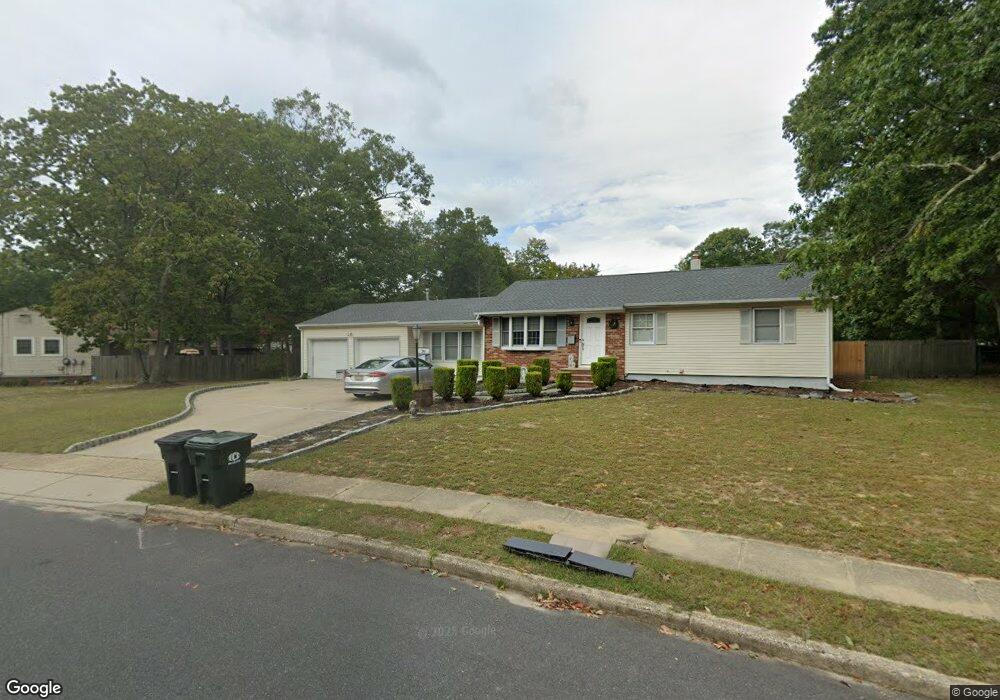
39 Darien Rd Howell, NJ 07731
Salem Hill NeighborhoodEstimated Value: $667,000 - $828,000
--
Bed
3
Baths
2,888
Sq Ft
$267/Sq Ft
Est. Value
About This Home
This home is located at 39 Darien Rd, Howell, NJ 07731 and is currently estimated at $772,066, approximately $267 per square foot. 39 Darien Rd is a home located in Monmouth County with nearby schools including Land O' Pines School, Newbury School, and Howell Middle School North.
Ownership History
Date
Name
Owned For
Owner Type
Purchase Details
Closed on
Aug 6, 2011
Sold by
Delgrasso Laurie Ann and Ladinski Laurie Ann
Bought by
Delgrasso James and Del Grasso Laurie Ann
Current Estimated Value
Home Financials for this Owner
Home Financials are based on the most recent Mortgage that was taken out on this home.
Original Mortgage
$284,000
Interest Rate
4.51%
Mortgage Type
New Conventional
Create a Home Valuation Report for This Property
The Home Valuation Report is an in-depth analysis detailing your home's value as well as a comparison with similar homes in the area
Home Values in the Area
Average Home Value in this Area
Purchase History
| Date | Buyer | Sale Price | Title Company |
|---|---|---|---|
| Delgrasso James | -- | Mortgage Information Service |
Source: Public Records
Mortgage History
| Date | Status | Borrower | Loan Amount |
|---|---|---|---|
| Closed | Delgrasso James | $284,000 |
Source: Public Records
Tax History
| Year | Tax Paid | Tax Assessment Tax Assessment Total Assessment is a certain percentage of the fair market value that is determined by local assessors to be the total taxable value of land and additions on the property. | Land | Improvement |
|---|---|---|---|---|
| 2025 | $12,649 | $778,900 | $370,900 | $408,000 |
| 2024 | $12,136 | $711,400 | $310,900 | $400,500 |
| 2023 | $12,136 | $652,100 | $260,900 | $391,200 |
| 2022 | $11,875 | $570,400 | $197,900 | $372,500 |
| 2021 | $11,875 | $517,200 | $185,900 | $331,300 |
| 2020 | $12,058 | $519,300 | $163,400 | $355,900 |
| 2019 | $11,925 | $504,000 | $154,200 | $349,800 |
| 2018 | $11,393 | $478,500 | $145,000 | $333,500 |
| 2017 | $11,241 | $466,800 | $143,400 | $323,400 |
| 2016 | $10,788 | $443,600 | $128,400 | $315,200 |
| 2015 | $10,727 | $436,600 | $129,500 | $307,100 |
| 2014 | $10,137 | $382,800 | $138,800 | $244,000 |
Source: Public Records
Map
Nearby Homes
- 43 Darien Rd
- 21 Christopher Dr
- 254 Aldrich Rd
- 9 Spruce Rd
- 4 Christopher Dr
- 47 Sun Hollow Rd
- 2 Lyndon Ln
- 0 Windeler Rd Unit 22523932
- 28 Salem Hill Rd
- 133 Starlight Rd
- 7 Cherry Bend Dr
- 138 Windeler Rd
- 28 Princeton Dr
- 159 Newbury Rd
- 9 Chatham Dr
- 6 Reuben Ct
- 302 Princeton Dr
- 10 Lexington Rd
- 58 Danella Way
- 85 Starlight Rd
Your Personal Tour Guide
Ask me questions while you tour the home.