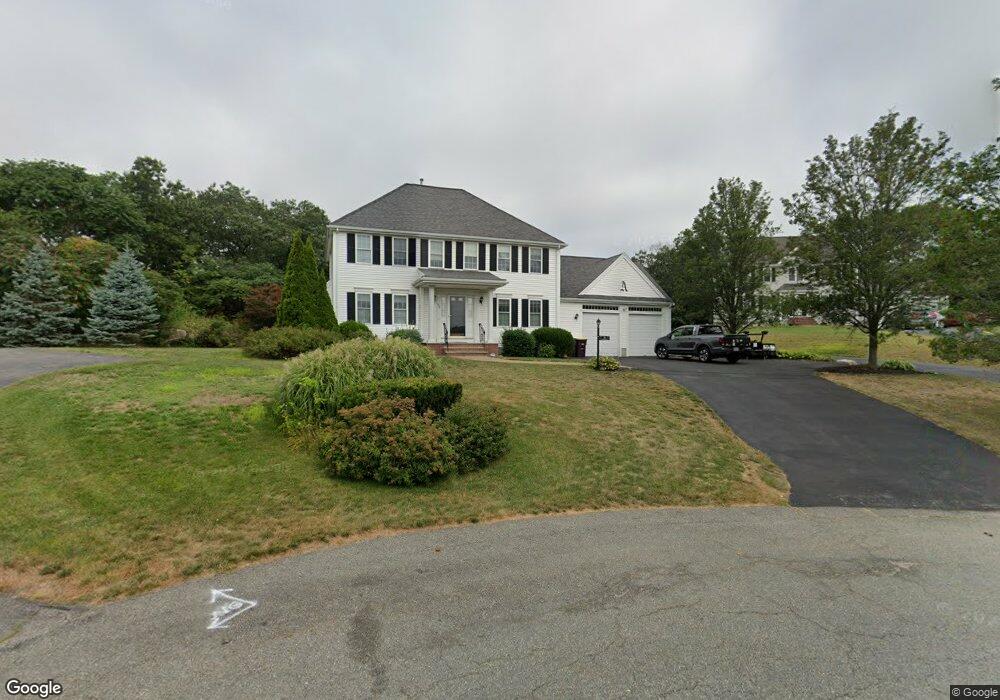
39 Df Haviland Ln Weymouth, MA 02188
Weymouth Landing NeighborhoodEstimated Value: $616,000 - $942,000
3
Beds
3
Baths
1,892
Sq Ft
$424/Sq Ft
Est. Value
About This Home
This home is located at 39 Df Haviland Ln, Weymouth, MA 02188 and is currently estimated at $801,679, approximately $423 per square foot. 39 Df Haviland Ln is a home located in Norfolk County with nearby schools including Frederick C Murphy, Abigail Adams Middle School, and Weymouth Middle School Chapman.
Ownership History
Date
Name
Owned For
Owner Type
Purchase Details
Closed on
Sep 14, 2015
Sold by
Aldrich David R
Bought by
Aldrich Ft
Current Estimated Value
Purchase Details
Closed on
Apr 15, 2005
Sold by
Batukhan Llc
Bought by
Aldrich David R and Aldrich Sandra A
Home Financials for this Owner
Home Financials are based on the most recent Mortgage that was taken out on this home.
Original Mortgage
$125,000
Interest Rate
5.78%
Mortgage Type
Purchase Money Mortgage
Create a Home Valuation Report for This Property
The Home Valuation Report is an in-depth analysis detailing your home's value as well as a comparison with similar homes in the area
Home Values in the Area
Average Home Value in this Area
Purchase History
| Date | Buyer | Sale Price | Title Company |
|---|---|---|---|
| Aldrich Ft | -- | -- | |
| Aldrich David R | $550,000 | -- |
Source: Public Records
Mortgage History
| Date | Status | Borrower | Loan Amount |
|---|---|---|---|
| Previous Owner | Aldrich David R | $175,000 | |
| Previous Owner | Aldrich David R | $125,000 |
Source: Public Records
Tax History Compared to Growth
Tax History
| Year | Tax Paid | Tax Assessment Tax Assessment Total Assessment is a certain percentage of the fair market value that is determined by local assessors to be the total taxable value of land and additions on the property. | Land | Improvement |
|---|---|---|---|---|
| 2025 | $9,106 | $901,600 | $274,600 | $627,000 |
| 2024 | $8,896 | $866,200 | $261,600 | $604,600 |
| 2023 | $8,228 | $787,400 | $242,200 | $545,200 |
| 2022 | $8,030 | $700,700 | $224,300 | $476,400 |
| 2021 | $7,393 | $629,700 | $224,300 | $405,400 |
| 2020 | $7,078 | $593,800 | $224,300 | $369,500 |
| 2019 | $6,952 | $573,600 | $215,700 | $357,900 |
| 2018 | $6,870 | $549,600 | $213,900 | $335,700 |
| 2017 | $6,696 | $522,700 | $203,800 | $318,900 |
| 2016 | $6,651 | $519,600 | $195,900 | $323,700 |
| 2015 | $6,364 | $493,300 | $195,900 | $297,400 |
| 2014 | $6,133 | $461,100 | $182,300 | $278,800 |
Source: Public Records
Map
Nearby Homes
- 19 Vine St Unit 3
- 19 Vine St Unit 1
- 114 Broad St Unit D
- 114 Broad St Unit C
- 23-25 Lindbergh Ave
- 16 Lindbergh Ave
- 33 Congress St
- 76 Kingman St
- 11 Richmond St
- 286 Broad St
- 122 Washington St Unit 22
- 12 Klasson Ln
- 15 Summer St
- 24 Blake Rd
- 54 Federal St
- 286 Essex St
- 367 Essex St
- 36 Brookside Rd
- 48 Apple Tree Ln
- 42 Sundin Rd