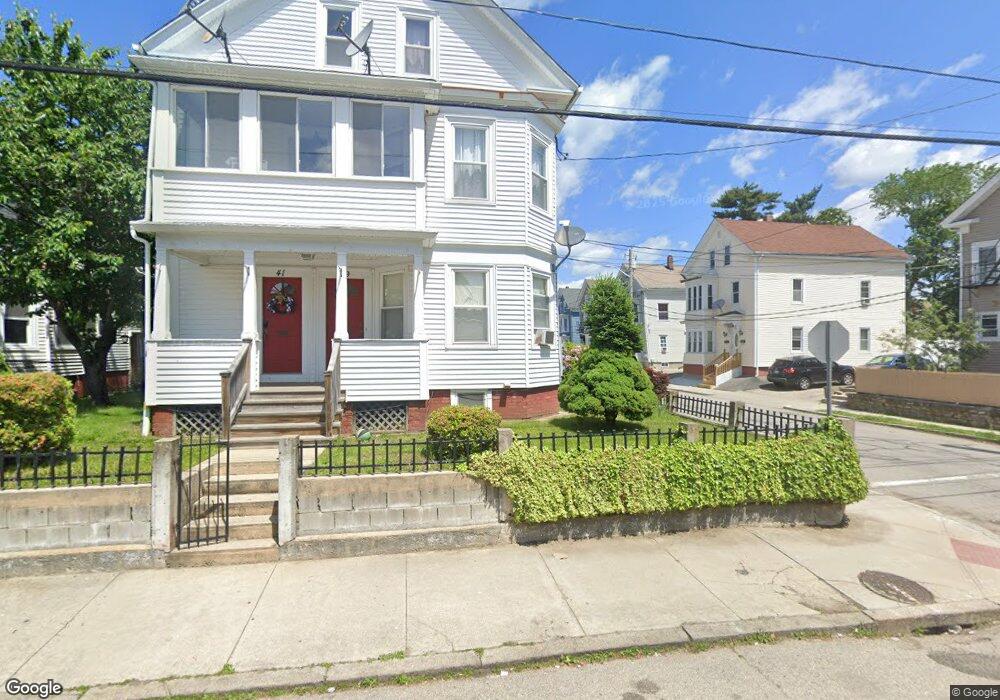
39 Dorchester Ave Providence, RI 02909
Silver Lake NeighborhoodEstimated Value: $597,000 - $685,000
6
Beds
3
Baths
2,850
Sq Ft
$225/Sq Ft
Est. Value
About This Home
This home is located at 39 Dorchester Ave, Providence, RI 02909 and is currently estimated at $642,667, approximately $225 per square foot. 39 Dorchester Ave is a home located in Providence County with nearby schools including Charles N. Fortes Elementary School, Asa Messer Elementary School, and Laurel Hill Annex School.
Ownership History
Date
Name
Owned For
Owner Type
Purchase Details
Closed on
May 15, 1996
Sold by
Providence Plan Hsng
Bought by
Lopez Pedro J and Lopez Hilda
Current Estimated Value
Home Financials for this Owner
Home Financials are based on the most recent Mortgage that was taken out on this home.
Original Mortgage
$85,200
Outstanding Balance
$4,172
Interest Rate
7.77%
Mortgage Type
Purchase Money Mortgage
Estimated Equity
$638,495
Purchase Details
Closed on
Nov 29, 1994
Sold by
Santamaria Marguerite and Santamaria Albert
Bought by
Prov Plan Hsng Corp
Create a Home Valuation Report for This Property
The Home Valuation Report is an in-depth analysis detailing your home's value as well as a comparison with similar homes in the area
Home Values in the Area
Average Home Value in this Area
Purchase History
| Date | Buyer | Sale Price | Title Company |
|---|---|---|---|
| Lopez Pedro J | $85,000 | -- | |
| Prov Plan Hsng Corp | $35,000 | -- |
Source: Public Records
Mortgage History
| Date | Status | Borrower | Loan Amount |
|---|---|---|---|
| Open | Prov Plan Hsng Corp | $25,000 | |
| Open | Prov Plan Hsng Corp | $85,200 |
Source: Public Records
Tax History Compared to Growth
Tax History
| Year | Tax Paid | Tax Assessment Tax Assessment Total Assessment is a certain percentage of the fair market value that is determined by local assessors to be the total taxable value of land and additions on the property. | Land | Improvement |
|---|---|---|---|---|
| 2025 | $7,196 | $514,000 | $129,600 | $384,400 |
| 2024 | $6,156 | $335,500 | $72,900 | $262,600 |
| 2023 | $6,156 | $335,500 | $72,900 | $262,600 |
| 2022 | $5,972 | $335,500 | $72,900 | $262,600 |
| 2021 | $5,258 | $214,100 | $48,300 | $165,800 |
| 2020 | $5,258 | $214,100 | $48,300 | $165,800 |
| 2019 | $5,258 | $214,100 | $48,300 | $165,800 |
| 2018 | $4,931 | $154,300 | $46,800 | $107,500 |
| 2017 | $4,931 | $154,300 | $46,800 | $107,500 |
| 2016 | $4,931 | $154,300 | $46,800 | $107,500 |
| 2015 | $4,452 | $134,500 | $49,700 | $84,800 |
| 2014 | $4,539 | $134,500 | $49,700 | $84,800 |
| 2013 | $4,539 | $134,500 | $49,700 | $84,800 |
Source: Public Records
Map
Nearby Homes
- 64 Ralph St
- 20 Dewey St
- 29 Dunford St
- 122 Laban St
- 78 Whittier Ave
- 22 Bancroft St
- 62 Heath St
- 144 Daniel Ave
- 663 Plainfield St
- 50 Laban St
- 41 Terrace Ave
- 160 Magnolia St
- 20 Magdalene St
- 240 Eastwood Ave
- 38 Judith St
- 47 Alverson Ave
- 14 Shafter St
- 79 Priscilla Ave
- 355 Laurel Hill Ave
- 27 What Cheer Ave