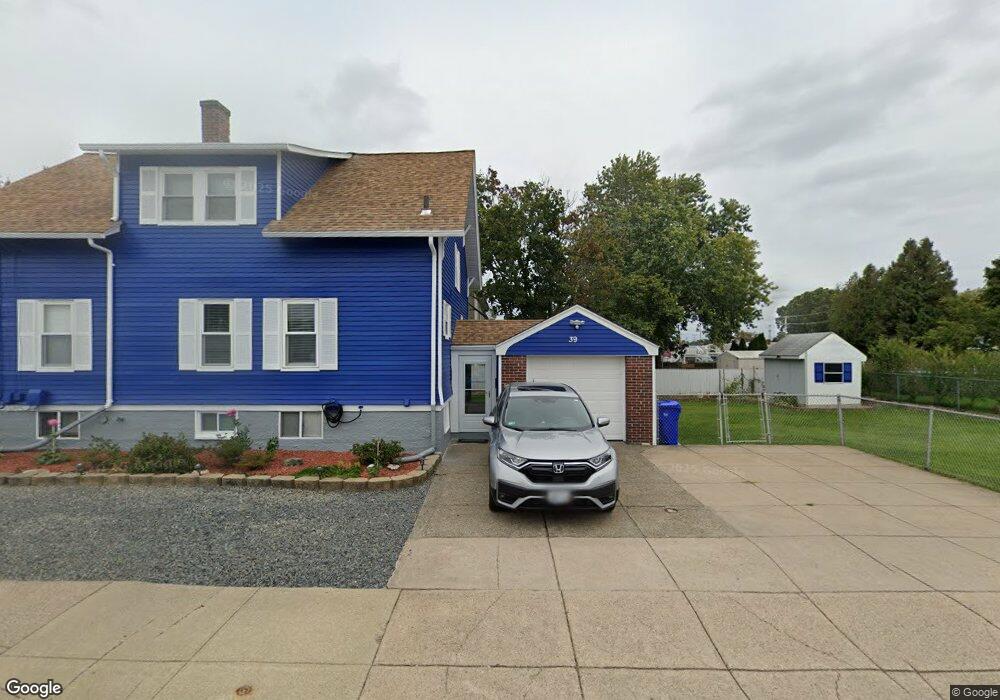
39 Dover St Pawtucket, RI 02860
Beverage Hill-The Plains NeighborhoodEstimated Value: $414,000 - $442,000
4
Beds
2
Baths
2,147
Sq Ft
$199/Sq Ft
Est. Value
About This Home
This home is located at 39 Dover St, Pawtucket, RI 02860 and is currently estimated at $427,568, approximately $199 per square foot. 39 Dover St is a home located in Providence County with nearby schools including Saint Teresa Catholic Elementary School and Saint Raphael Academy.
Ownership History
Date
Name
Owned For
Owner Type
Purchase Details
Closed on
Apr 27, 2021
Sold by
Sequen Consuelo
Bought by
Constanza Everto and Corra Melissa E
Current Estimated Value
Home Financials for this Owner
Home Financials are based on the most recent Mortgage that was taken out on this home.
Original Mortgage
$267,300
Outstanding Balance
$239,444
Interest Rate
3.05%
Mortgage Type
Purchase Money Mortgage
Estimated Equity
$188,124
Purchase Details
Closed on
Oct 5, 2012
Sold by
Sequen Carmelo and Sequen Consuelo
Bought by
Sequen Consuelo
Purchase Details
Closed on
Sep 29, 2008
Sold by
Isabel Gregory
Bought by
Sequen Carmelo and Sequen Consuelo
Purchase Details
Closed on
Aug 1, 2003
Sold by
Fusi Dorothy E
Bought by
Isabel Gregory and Isabel Marie
Create a Home Valuation Report for This Property
The Home Valuation Report is an in-depth analysis detailing your home's value as well as a comparison with similar homes in the area
Home Values in the Area
Average Home Value in this Area
Purchase History
| Date | Buyer | Sale Price | Title Company |
|---|---|---|---|
| Constanza Everto | $297,000 | None Available | |
| Sequen Consuelo | -- | -- | |
| Sequen Carmelo | $175,000 | -- | |
| Isabel Gregory | $228,500 | -- |
Source: Public Records
Mortgage History
| Date | Status | Borrower | Loan Amount |
|---|---|---|---|
| Open | Constanza Everto | $267,300 | |
| Previous Owner | Isabel Gregory | $25,000 | |
| Previous Owner | Isabel Gregory | $170,000 |
Source: Public Records
Tax History
| Year | Tax Paid | Tax Assessment Tax Assessment Total Assessment is a certain percentage of the fair market value that is determined by local assessors to be the total taxable value of land and additions on the property. | Land | Improvement |
|---|---|---|---|---|
| 2025 | $4,472 | $340,100 | $139,800 | $200,300 |
| 2024 | $4,197 | $340,100 | $139,800 | $200,300 |
| 2023 | $3,793 | $223,900 | $85,000 | $138,900 |
| 2022 | $3,712 | $223,900 | $85,000 | $138,900 |
| 2021 | $3,712 | $223,900 | $85,000 | $138,900 |
| 2020 | $3,353 | $160,500 | $64,300 | $96,200 |
| 2019 | $3,353 | $160,500 | $64,300 | $96,200 |
| 2018 | $3,231 | $160,500 | $64,300 | $96,200 |
| 2017 | $2,858 | $125,800 | $50,600 | $75,200 |
| 2016 | $2,754 | $125,800 | $50,600 | $75,200 |
| 2015 | $2,754 | $125,800 | $50,600 | $75,200 |
| 2014 | $2,631 | $114,100 | $50,600 | $63,500 |
Source: Public Records
Map
Nearby Homes
Your Personal Tour Guide
Ask me questions while you tour the home.