Estimated Value: $354,268 - $383,000
3
Beds
1
Bath
1,092
Sq Ft
$342/Sq Ft
Est. Value
About This Home
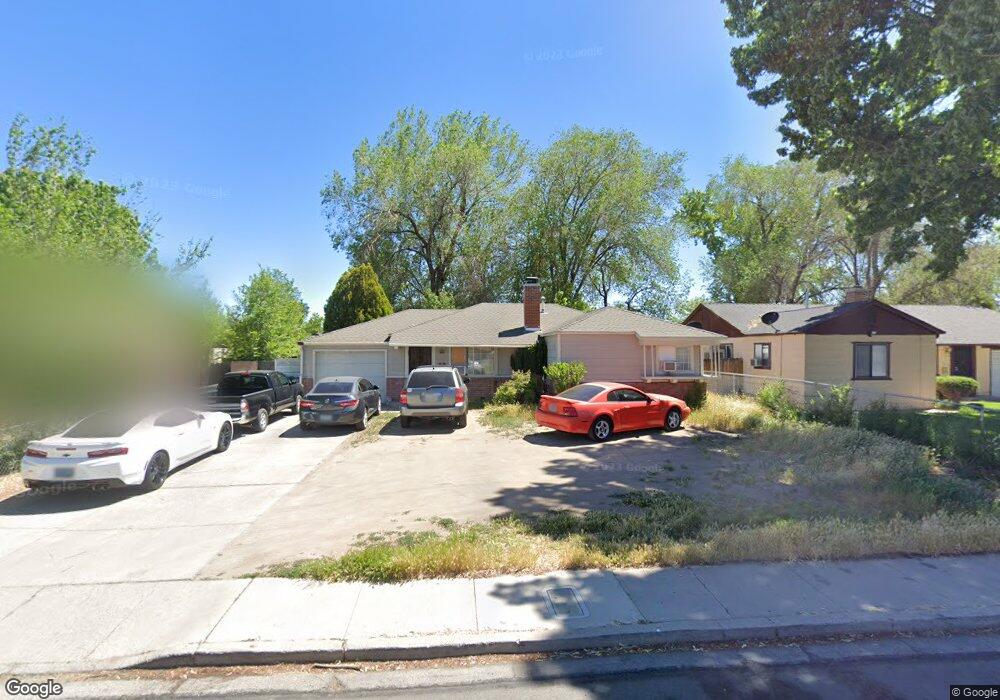
This home is located at 39 E I St, Sparks, NV 89431 and is currently estimated at $373,067, approximately $341 per square foot. 39 E I St is a home located in Washoe County with nearby schools including Greenbrae Elementary School, George L Dilworth Middle School, and Sparks High School.
Ownership History
Date
Name
Owned For
Owner Type
Purchase Details
Closed on
Nov 18, 2008
Sold by
Anderson James R and Anderson Dorine J
Bought by
Anderson James R and Anderson Dorine J
Current Estimated Value
Home Financials for this Owner
Home Financials are based on the most recent Mortgage that was taken out on this home.
Original Mortgage
$117,040
Outstanding Balance
$76,151
Interest Rate
6.07%
Mortgage Type
Stand Alone Refi Refinance Of Original Loan
Estimated Equity
$296,916
Purchase Details
Closed on
Nov 13, 2008
Sold by
Anderson James R
Bought by
Anderson James R and Anderson Dorine J
Home Financials for this Owner
Home Financials are based on the most recent Mortgage that was taken out on this home.
Original Mortgage
$117,040
Outstanding Balance
$76,151
Interest Rate
6.07%
Mortgage Type
Stand Alone Refi Refinance Of Original Loan
Estimated Equity
$296,916
Purchase Details
Closed on
Jun 26, 2008
Sold by
Anderson Stacy
Bought by
Anderson James R
Purchase Details
Closed on
Aug 1, 2003
Sold by
Anderson James R
Bought by
Anderson James R and Anderson Stacy
Home Financials for this Owner
Home Financials are based on the most recent Mortgage that was taken out on this home.
Original Mortgage
$109,600
Interest Rate
5.13%
Mortgage Type
Unknown
Purchase Details
Closed on
Jul 30, 2003
Sold by
Anderson Stacy
Bought by
Anderson James R
Home Financials for this Owner
Home Financials are based on the most recent Mortgage that was taken out on this home.
Original Mortgage
$109,600
Interest Rate
5.13%
Mortgage Type
Unknown
Purchase Details
Closed on
Jul 18, 2003
Sold by
Nahorniak Melissa A and Nahorniak Eric
Bought by
Anderson James R
Home Financials for this Owner
Home Financials are based on the most recent Mortgage that was taken out on this home.
Original Mortgage
$109,600
Interest Rate
5.13%
Mortgage Type
Unknown
Purchase Details
Closed on
Aug 13, 2001
Sold by
Nahorniak Charlie M and Nahorniak Linda C
Bought by
Nahorniak Eric and Nahorniak Melissa A
Home Financials for this Owner
Home Financials are based on the most recent Mortgage that was taken out on this home.
Original Mortgage
$112,990
Interest Rate
7.19%
Mortgage Type
FHA
Purchase Details
Closed on
May 7, 1996
Sold by
Evans Denton Eugene
Bought by
Nahorniak Linda C and Evans Linda
Purchase Details
Closed on
Feb 21, 1996
Sold by
Nahorniak Linda C and Evans Linda
Bought by
Nahorniak Charlie M and Nahorniak Linda C
Home Financials for this Owner
Home Financials are based on the most recent Mortgage that was taken out on this home.
Original Mortgage
$80,800
Interest Rate
7.68%
Create a Home Valuation Report for This Property
The Home Valuation Report is an in-depth analysis detailing your home's value as well as a comparison with similar homes in the area
Home Values in the Area
Average Home Value in this Area
Purchase History
| Date | Buyer | Sale Price | Title Company |
|---|---|---|---|
| Anderson James R | -- | None Available | |
| Anderson James R | -- | First American Title Reno | |
| Anderson James R | -- | None Available | |
| Anderson James R | -- | First Centennial Title Co | |
| Anderson James R | $137,000 | First Centennial Title Co | |
| Anderson James R | $137,000 | First Centennial Title Co | |
| Nahorniak Eric | $114,000 | Founders Title Co | |
| Nahorniak Linda C | -- | Western Title Company Inc | |
| Nahorniak Charlie M | -- | Western Title Company Inc |
Source: Public Records
Mortgage History
| Date | Status | Borrower | Loan Amount |
|---|---|---|---|
| Open | Anderson James R | $117,040 | |
| Previous Owner | Anderson James R | $109,600 | |
| Previous Owner | Nahorniak Eric | $112,990 | |
| Previous Owner | Nahorniak Charlie M | $80,800 | |
| Closed | Nahorniak Eric | $5,700 |
Source: Public Records
Tax History
| Year | Tax Paid | Tax Assessment Tax Assessment Total Assessment is a certain percentage of the fair market value that is determined by local assessors to be the total taxable value of land and additions on the property. | Land | Improvement |
|---|---|---|---|---|
| 2026 | $533 | $50,414 | $34,090 | $16,324 |
| 2024 | $665 | $46,051 | $30,065 | $15,986 |
| 2023 | $646 | $46,106 | $31,325 | $14,781 |
| 2022 | $627 | $38,190 | $26,180 | $12,010 |
| 2021 | $610 | $29,697 | $17,955 | $11,742 |
| 2020 | $591 | $28,466 | $16,940 | $11,526 |
| 2019 | $573 | $26,781 | $15,890 | $10,891 |
| 2018 | $557 | $22,162 | $11,725 | $10,437 |
| 2017 | $541 | $20,645 | $10,395 | $10,250 |
| 2016 | $526 | $19,599 | $9,345 | $10,254 |
| 2015 | $525 | $17,764 | $7,700 | $10,064 |
| 2014 | $509 | $15,951 | $6,440 | $9,511 |
| 2013 | -- | $13,533 | $4,270 | $9,263 |
Source: Public Records
Map
Nearby Homes
- 11 E J St
- 31 E L St
- 370 O'Brien Way
- 480 E Mclean Way
- 483 Beacon Hill Ct Unit 16-D
- 14 E Greenbrae Dr
- 601 Oakwood Dr Unit 4
- 959 Mesa Ridge Dr Unit 2
- 8 E O St
- 560 Nichols Blvd
- 801 Woodglen Dr Unit 2
- 314 M St
- 828 Woodglen Dr Unit 2
- 115 P St
- 995 Sage View Dr
- 960 Cherry Tree Dr Unit 1
- 860 Cherry Tree Dr Unit 2
- 953 7th St
- 1940 4th St Unit 20
- 1940 4th St Unit 51
Your Personal Tour Guide
Ask me questions while you tour the home.