Estimated Value: $203,153 - $267,000
3
Beds
1
Bath
1,538
Sq Ft
$149/Sq Ft
Est. Value
About This Home
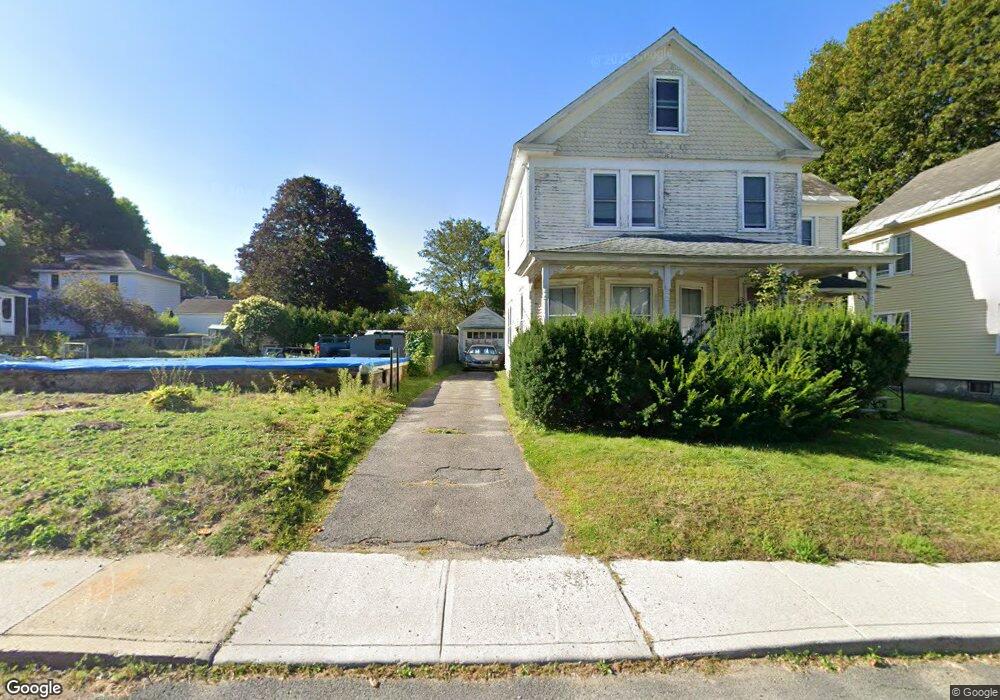
This home is located at 39 E Jordan St, Adams, MA 01220 and is currently estimated at $229,538, approximately $149 per square foot. 39 E Jordan St is a home located in Berkshire County with nearby schools including Hoosac Valley Middle & High School, Berkshire Arts & Technology Charter Public School, and St. Stanislaus Kostka School.
Ownership History
Date
Name
Owned For
Owner Type
Purchase Details
Closed on
May 2, 1997
Sold by
Frodyma Francis J
Bought by
Burke Richard M
Current Estimated Value
Home Financials for this Owner
Home Financials are based on the most recent Mortgage that was taken out on this home.
Original Mortgage
$70,300
Outstanding Balance
$9,504
Interest Rate
7.85%
Mortgage Type
Purchase Money Mortgage
Estimated Equity
$220,034
Create a Home Valuation Report for This Property
The Home Valuation Report is an in-depth analysis detailing your home's value as well as a comparison with similar homes in the area
Home Values in the Area
Average Home Value in this Area
Purchase History
| Date | Buyer | Sale Price | Title Company |
|---|---|---|---|
| Burke Richard M | $74,000 | -- |
Source: Public Records
Mortgage History
| Date | Status | Borrower | Loan Amount |
|---|---|---|---|
| Open | Burke Richard M | $70,300 |
Source: Public Records
Tax History
| Year | Tax Paid | Tax Assessment Tax Assessment Total Assessment is a certain percentage of the fair market value that is determined by local assessors to be the total taxable value of land and additions on the property. | Land | Improvement |
|---|---|---|---|---|
| 2025 | $3,074 | $180,700 | $43,100 | $137,600 |
| 2024 | $2,899 | $165,300 | $40,400 | $124,900 |
| 2023 | $2,708 | $146,000 | $37,200 | $108,800 |
| 2022 | $2,645 | $126,600 | $32,300 | $94,300 |
| 2021 | $2,595 | $114,700 | $32,300 | $82,400 |
| 2020 | $2,453 | $112,100 | $32,400 | $79,700 |
| 2019 | $2,398 | $112,100 | $32,400 | $79,700 |
| 2018 | $2,459 | $110,700 | $32,400 | $78,300 |
| 2017 | $2,366 | $110,700 | $32,400 | $78,300 |
| 2016 | $2,289 | $107,000 | $32,400 | $74,600 |
| 2015 | $2,244 | $105,000 | $34,100 | $70,900 |
| 2014 | $2,095 | $105,000 | $34,100 | $70,900 |
Source: Public Records
Map
Nearby Homes
- 37 E Jordan St
- 18 Richmond Ln
- 20 Richmond Ln
- 16 Richmond Ln
- 6 Baskin Ln
- 40 E Jordan St Unit 3
- 40 E Jordan St Unit 4
- 40 E Jordan St
- 31 N Summer St
- 25 N Summer St
- 42 E Jordan St
- 14 Richmond Ln
- 8 Baskin Ln
- 44 E Jordan St
- 35 N Summer St
- 46 E Jordan St
- 4 Baskin Ln
- 21 Richmond Ln
- 15 Richmond Ln
- 25 Richmond Ln
Your Personal Tour Guide
Ask me questions while you tour the home.