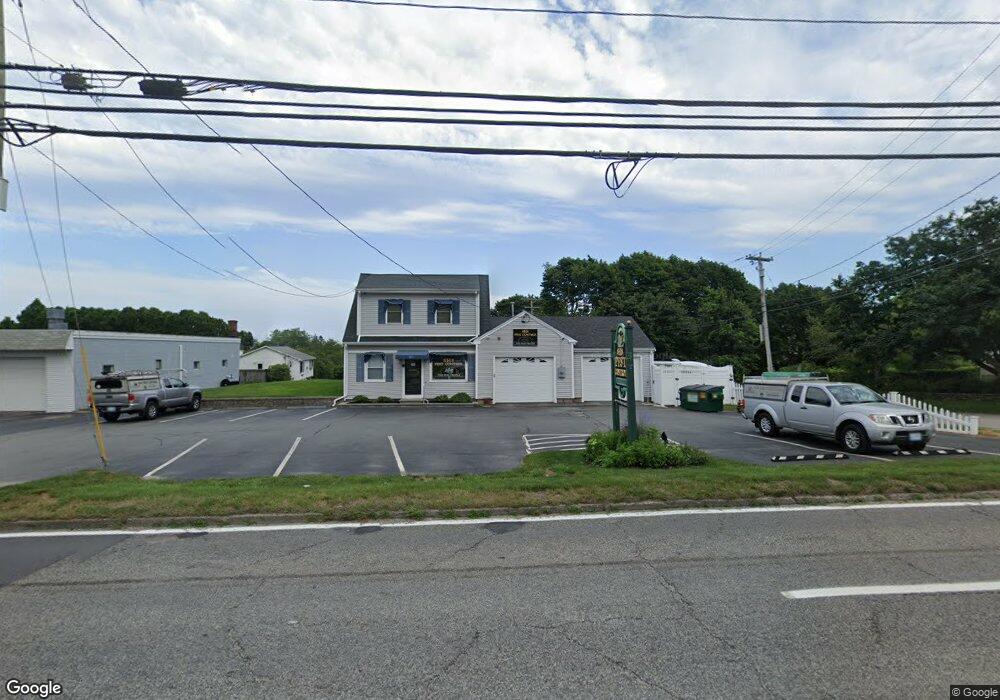
39 E Main Rd Portsmouth, RI 02871
South Portsmouth NeighborhoodEstimated Value: $368,357
--
Bed
--
Bath
1,907
Sq Ft
$193/Sq Ft
Est. Value
About This Home
This home is located at 39 E Main Rd, Portsmouth, RI 02871 and is currently estimated at $368,357, approximately $193 per square foot. 39 E Main Rd is a home located in Newport County with nearby schools including Portsmouth High School, The Pennfield School, and All Saints STEAM Academy.
Ownership History
Date
Name
Owned For
Owner Type
Purchase Details
Closed on
Sep 2, 2022
Sold by
Nascimento Ernest E
Bought by
Ernest E Nascimento T
Current Estimated Value
Purchase Details
Closed on
Oct 16, 2003
Sold by
Tynan Sidney
Bought by
Nascimento Ernest
Home Financials for this Owner
Home Financials are based on the most recent Mortgage that was taken out on this home.
Original Mortgage
$100,000
Interest Rate
6.43%
Mortgage Type
Commercial
Create a Home Valuation Report for This Property
The Home Valuation Report is an in-depth analysis detailing your home's value as well as a comparison with similar homes in the area
Home Values in the Area
Average Home Value in this Area
Purchase History
| Date | Buyer | Sale Price | Title Company |
|---|---|---|---|
| Ernest E Nascimento T | -- | None Available | |
| Nascimento Ernest | $145,000 | -- |
Source: Public Records
Mortgage History
| Date | Status | Borrower | Loan Amount |
|---|---|---|---|
| Previous Owner | Nascimento Ernest | $100,000 |
Source: Public Records
Tax History Compared to Growth
Tax History
| Year | Tax Paid | Tax Assessment Tax Assessment Total Assessment is a certain percentage of the fair market value that is determined by local assessors to be the total taxable value of land and additions on the property. | Land | Improvement |
|---|---|---|---|---|
| 2025 | $3,384 | $254,800 | $101,400 | $153,400 |
| 2024 | $3,358 | $254,800 | $101,400 | $153,400 |
| 2023 | $3,256 | $254,800 | $101,400 | $153,400 |
| 2022 | $3,783 | $243,100 | $96,600 | $146,500 |
| 2021 | $3,722 | $243,100 | $96,600 | $146,500 |
| 2020 | $3,664 | $243,100 | $96,600 | $146,500 |
| 2019 | $3,544 | $216,100 | $87,100 | $129,000 |
| 2018 | $3,451 | $216,100 | $87,100 | $129,000 |
| 2017 | $3,332 | $216,100 | $87,100 | $129,000 |
| 2016 | $3,306 | $206,600 | $86,200 | $120,400 |
| 2015 | $3,264 | $206,600 | $86,200 | $120,400 |
| 2014 | $3,136 | $198,500 | $86,200 | $112,300 |
Source: Public Records
Map
Nearby Homes
- 134 E Main Rd
- 92 Harvest Dr
- 0 Coggeshall Way
- 362 Bramans Ln
- 481 Oliphant Ln
- 836 Forest Park
- 841 Forest Park
- 533 Forest Park
- 529 Forest Park
- 521 Forest Park
- 50 Eastover & Lot Rd
- 230 Briarwood Ln
- 180 Cottontail Dr
- 63 Clearview Ave
- 19 Cows Path Rd
- 223 Corey Ln
- 6 Wabasso Terrace
- 18 J h Dwyer Dr
- 10 Bartlett Rd
- 68 Rebels Way