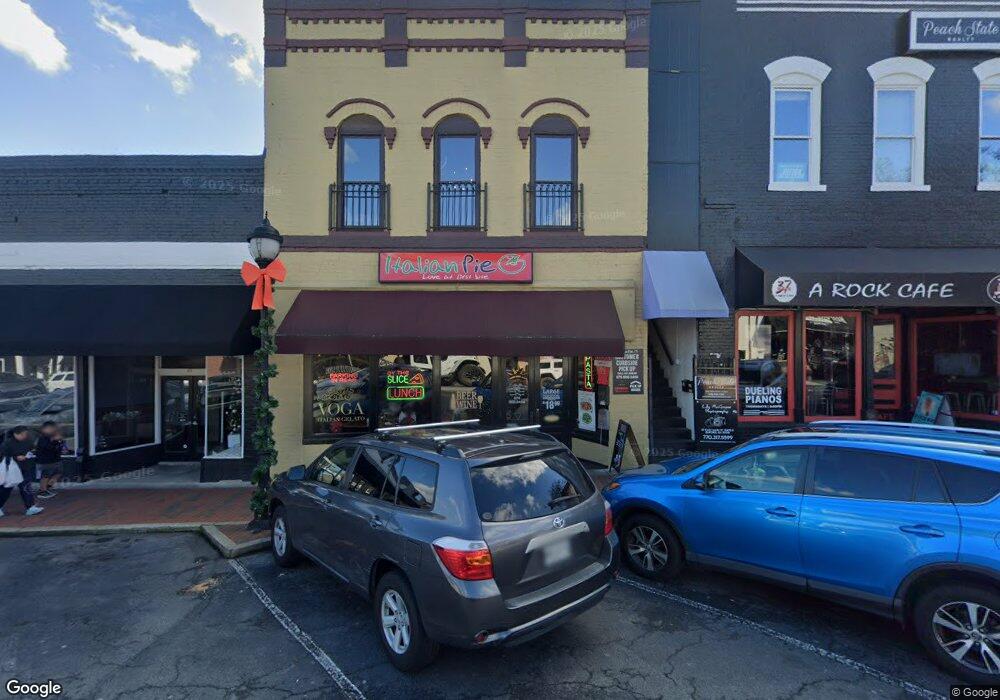
39 E Main St Buford, GA 30518
Studio
2
Baths
4,246
Sq Ft
3,049
Sq Ft Lot
About This Home
This home is located at 39 E Main St, Buford, GA 30518. 39 E Main St is a home located in Gwinnett County with nearby schools including Buford Elementary School, Buford Senior Academy, and Buford Academy.
Ownership History
Date
Name
Owned For
Owner Type
Purchase Details
Closed on
Mar 30, 2015
Sold by
Johnson Shari E
Bought by
39 E Main St Llc
Purchase Details
Closed on
Mar 6, 2015
Sold by
Southeastern Real Estate Devel
Bought by
Johnson Shari E
Purchase Details
Closed on
Jan 12, 2015
Sold by
United Bank
Bought by
Southeastern Real Estate Devel
Purchase Details
Closed on
Dec 2, 2014
Sold by
Brown Christopher W
Bought by
United Bank
Purchase Details
Closed on
Mar 21, 2007
Sold by
Jb Brown & Associates Llc
Bought by
Brown Christopher W
Home Financials for this Owner
Home Financials are based on the most recent Mortgage that was taken out on this home.
Original Mortgage
$612,000
Interest Rate
6.27%
Purchase Details
Closed on
Mar 2, 2006
Sold by
Slotin Steve B and Slotin Peggy
Bought by
J W Brown & Assocs Llc
Purchase Details
Closed on
Mar 10, 2000
Sold by
Kreyer Robert R and Kreyer Margaret M
Bought by
Slotin Steve B
Home Financials for this Owner
Home Financials are based on the most recent Mortgage that was taken out on this home.
Original Mortgage
$120,000
Interest Rate
8.29%
Mortgage Type
Commercial
Create a Home Valuation Report for This Property
The Home Valuation Report is an in-depth analysis detailing your home's value as well as a comparison with similar homes in the area
Home Values in the Area
Average Home Value in this Area
Purchase History
| Date | Buyer | Sale Price | Title Company |
|---|---|---|---|
| 39 E Main St Llc | -- | -- | |
| 39 E Main St Llc | -- | -- | |
| Johnson Shari E | $180,000 | -- | |
| Johnson Shari E | $180,000 | -- | |
| Southeastern Real Estate Devel | -- | -- | |
| Southeastern Real Estate Devel | -- | -- | |
| United Bank | $180,000 | -- | |
| United Bank | $180,000 | -- | |
| Brown Christopher W | $590,000 | -- | |
| Brown Christopher W | $590,000 | -- | |
| J W Brown & Assocs Llc | $550,000 | -- | |
| J W Brown & Assocs Llc | $550,000 | -- | |
| Slotin Steve B | $150,000 | -- | |
| Slotin Steve B | $150,000 | -- |
Source: Public Records
Mortgage History
| Date | Status | Borrower | Loan Amount |
|---|---|---|---|
| Previous Owner | Brown Christopher W | $612,000 | |
| Previous Owner | Slotin Steve B | $120,000 |
Source: Public Records
Tax History Compared to Growth
Tax History
| Year | Tax Paid | Tax Assessment Tax Assessment Total Assessment is a certain percentage of the fair market value that is determined by local assessors to be the total taxable value of land and additions on the property. | Land | Improvement |
|---|---|---|---|---|
| 2025 | -- | $415,280 | $18,280 | $397,000 |
| 2024 | -- | $301,280 | $18,280 | $283,000 |
| 2023 | $3,054 | $212,800 | $14,640 | $198,160 |
| 2022 | $0 | $186,400 | $74,560 | $111,840 |
| 2021 | $507 | $107,960 | $24,400 | $83,560 |
| 2020 | $507 | $107,960 | $24,400 | $83,560 |
| 2019 | $507 | $65,960 | $11,400 | $54,560 |
| 2018 | $855 | $65,960 | $11,400 | $54,560 |
| 2016 | $845 | $65,960 | $11,400 | $54,560 |
| 2015 | $507 | $38,200 | $11,400 | $26,800 |
| 2014 | $515 | $38,200 | $11,400 | $26,800 |
Source: Public Records
Map
Nearby Homes
- 185 Scott St
- 550 Gwinnett St
- 304 E Jackson St
- 449 S Hill St
- 1769 Rowland Pass
- 460 Espy St
- 345 W Moreno St
- 425 Church St
- 4942 Greenard Watson Ln
- 7307 William St
- 490 Jackson St
- 4933 Greenard Watson Ln
- 2020 Harvester Ln
- 48 Stonehedge Ct
- 294 Watson St
- 613 Church St
- 140 Wilbanks St
- 150 Wilbanks St
- 570 Power Ave
- 110 Shadburn Ferry Rd
- 39 E Main St Unit A
- 13 E Main St
- 15 E Main St
- 79 E Main St NE
- 36 E Main St NE
- 36 E Main St
- 36 E Main St
- 60 Garnett St
- 0 E Shadburn Ave Unit 4164753
- 0 E Shadburn Ave Unit 10074896
- 0 E Shadburn Ave Unit 7089522
- E E Shadburn Ave Unit A
- E E Shadburn Ave Unit A-D
- E E Shadburn Ave Unit B
- E E Shadburn Ave Unit D
- E E Shadburn Ave Unit U
- E E Shadburn Ave
- 79 S Harris St
- 3 S Harris St
- 34 W Shadburn Ave