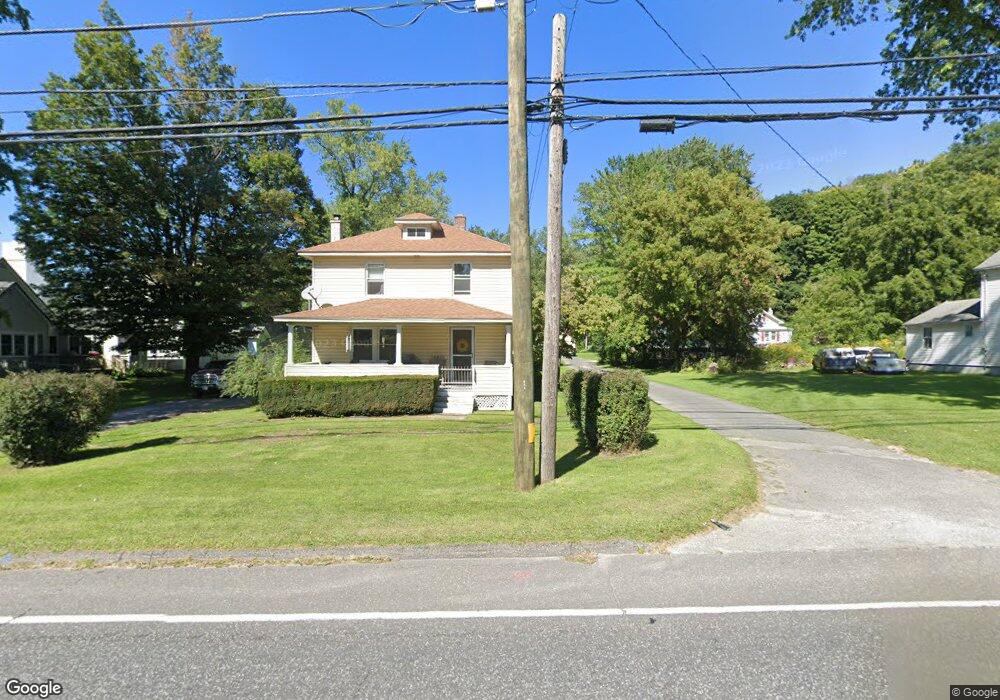
39 E Main St Canaan, CT 06018
Estimated Value: $231,000 - $281,000
2
Beds
1
Bath
1,022
Sq Ft
$261/Sq Ft
Est. Value
About This Home
This home is located at 39 E Main St, Canaan, CT 06018 and is currently estimated at $267,215, approximately $261 per square foot. 39 E Main St is a home located in Litchfield County with nearby schools including North Canaan Elementary School and Housatonic Valley Regional High School.
Ownership History
Date
Name
Owned For
Owner Type
Purchase Details
Closed on
Dec 12, 2000
Sold by
Lachance Raymond H and Lachance Robert W
Bought by
Gwinn Damian A and Burd Elizabeth M
Current Estimated Value
Home Financials for this Owner
Home Financials are based on the most recent Mortgage that was taken out on this home.
Original Mortgage
$100,500
Interest Rate
7.64%
Create a Home Valuation Report for This Property
The Home Valuation Report is an in-depth analysis detailing your home's value as well as a comparison with similar homes in the area
Home Values in the Area
Average Home Value in this Area
Purchase History
| Date | Buyer | Sale Price | Title Company |
|---|---|---|---|
| Gwinn Damian A | $100,900 | -- |
Source: Public Records
Mortgage History
| Date | Status | Borrower | Loan Amount |
|---|---|---|---|
| Open | Gwinn Damian A | $144,975 | |
| Closed | Gwinn Damian A | $164,000 | |
| Closed | Gwinn Damian A | $100,500 |
Source: Public Records
Tax History
| Year | Tax Paid | Tax Assessment Tax Assessment Total Assessment is a certain percentage of the fair market value that is determined by local assessors to be the total taxable value of land and additions on the property. | Land | Improvement |
|---|---|---|---|---|
| 2025 | $3,858 | $143,150 | $36,540 | $106,610 |
| 2024 | $3,543 | $143,150 | $36,540 | $106,610 |
| 2023 | $3,650 | $143,150 | $36,540 | $106,610 |
| 2022 | $3,176 | $102,460 | $35,420 | $67,040 |
| 2021 | $2,971 | $102,460 | $35,420 | $67,040 |
| 2020 | $3,120 | $102,460 | $35,420 | $67,040 |
| 2019 | $2,894 | $102,460 | $35,420 | $67,040 |
| 2018 | $2,818 | $102,460 | $35,420 | $67,040 |
| 2017 | $2,912 | $105,890 | $41,810 | $64,080 |
| 2016 | $2,912 | $105,890 | $41,810 | $64,080 |
| 2015 | $2,912 | $105,890 | $41,810 | $64,080 |
| 2014 | $2,912 | $105,890 | $41,810 | $64,080 |
Source: Public Records
Map
Nearby Homes
- 65 E Main St
- 00 N Elm St
- 26 Granite Ave
- 41 Prospect St
- 70 Church St Unit D1
- 143 E Canaan Rd
- 277 Ashley Falls Rd
- 37 Greene Ave
- 730 Clayton Rd
- 180 Sand Rd
- 0 Old Turnpike Rd N
- 354 Route 7 N
- 153 E Main St
- 2170 Canaan Southfield Rd
- 247 Twin Lakes Rd
- 1698 Clayton Mill River Rd
- 0 Alum Hill Unit 73415610
- 594 Shunpike Rd
- 100 Belden St
- 10 College Hill Rd
Your Personal Tour Guide
Ask me questions while you tour the home.