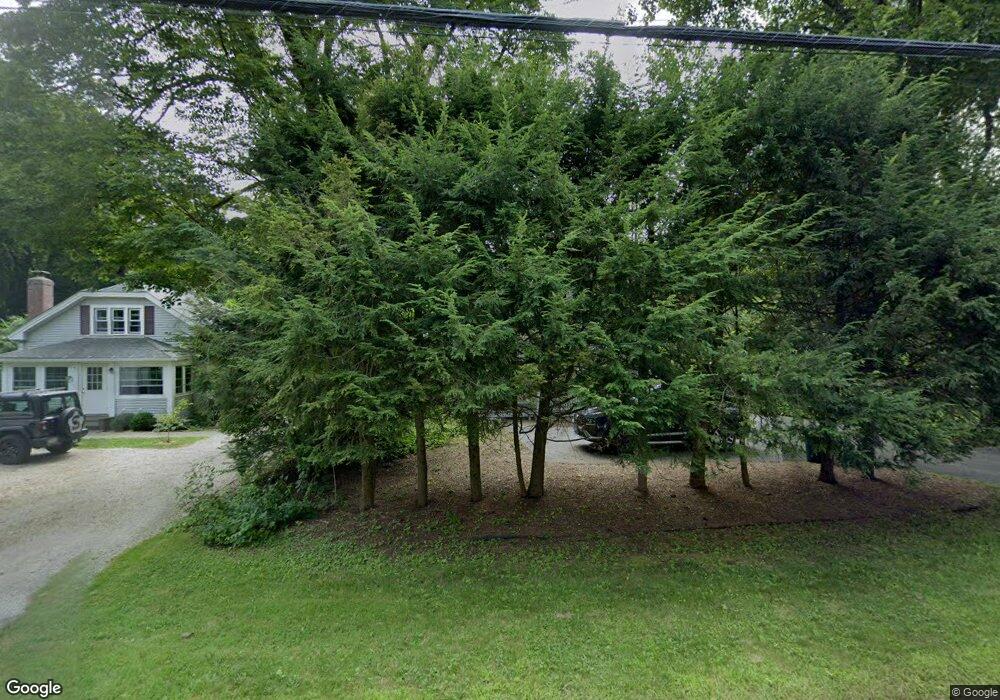
39 E Main St Salisbury, CT 06068
Estimated Value: $739,000 - $995,000
3
Beds
3
Baths
2,076
Sq Ft
$433/Sq Ft
Est. Value
About This Home
This home is located at 39 E Main St, Salisbury, CT 06068 and is currently estimated at $898,103, approximately $432 per square foot. 39 E Main St is a home located in Litchfield County with nearby schools including Housatonic Valley Regional High School, Indian Mountain School, and Salisbury School.
Ownership History
Date
Name
Owned For
Owner Type
Purchase Details
Closed on
Dec 5, 2005
Sold by
Schecter Douglas B and Schecter Natalie J
Bought by
Boccuto Barbara D
Current Estimated Value
Purchase Details
Closed on
Jan 30, 2002
Sold by
Bainbridge Dona B
Bought by
Schechter Natalie J and Schechter Douglas R
Purchase Details
Closed on
Jan 30, 1998
Sold by
Noble Karen
Bought by
Bainbridge Dona B
Create a Home Valuation Report for This Property
The Home Valuation Report is an in-depth analysis detailing your home's value as well as a comparison with similar homes in the area
Home Values in the Area
Average Home Value in this Area
Purchase History
| Date | Buyer | Sale Price | Title Company |
|---|---|---|---|
| Boccuto Barbara D | $750,000 | -- | |
| Boccuto Barbara D | $750,000 | -- | |
| Schechter Natalie J | $480,000 | -- | |
| Schechter Natalie J | $480,000 | -- | |
| Bainbridge Dona B | $212,000 | -- | |
| Bainbridge Dona B | $212,000 | -- |
Source: Public Records
Mortgage History
| Date | Status | Borrower | Loan Amount |
|---|---|---|---|
| Open | Bainbridge Dona B | $406,200 | |
| Closed | Bainbridge Dona B | $417,000 |
Source: Public Records
Tax History
| Year | Tax Paid | Tax Assessment Tax Assessment Total Assessment is a certain percentage of the fair market value that is determined by local assessors to be the total taxable value of land and additions on the property. | Land | Improvement |
|---|---|---|---|---|
| 2025 | $5,150 | $468,200 | $85,900 | $382,300 |
| 2024 | $5,150 | $468,200 | $85,900 | $382,300 |
| 2023 | $5,150 | $468,200 | $85,900 | $382,300 |
| 2022 | $5,150 | $468,200 | $85,900 | $382,300 |
| 2021 | $5,150 | $468,200 | $85,900 | $382,300 |
| 2020 | $5,420 | $467,200 | $75,600 | $391,600 |
| 2019 | $5,420 | $467,200 | $75,600 | $391,600 |
| 2018 | $5,279 | $467,200 | $75,600 | $391,600 |
| 2017 | $5,186 | $467,200 | $75,600 | $391,600 |
| 2016 | $4,999 | $467,200 | $75,600 | $391,600 |
| 2015 | $4,264 | $398,500 | $85,900 | $312,600 |
| 2014 | $4,539 | $432,300 | $102,300 | $330,000 |
Source: Public Records
Map
Nearby Homes
- 47 E Main St
- 0 Under Mountain Rd
- 60 Selleck Hill Rd
- 9 Prospect Mountain Rd
- 5 Prospect Mountain Rd
- 308 Main St
- 278 and 282 Farnum Rd
- 21 Perry St
- 8 Holley St
- 56 Sharon Rd
- 000 Under Mountain Rd
- 323 Wells Hill Rd
- 118 Washinee Heights Rd
- 406 Wells Hill Rd
- 8 Tokone Hills Rd
- 77 Beaver Dam Rd
- 77 Belgo Rd
- 100 Belden St
- 163 Dublin Rd
- 24 Ore Hill Rd
Your Personal Tour Guide
Ask me questions while you tour the home.