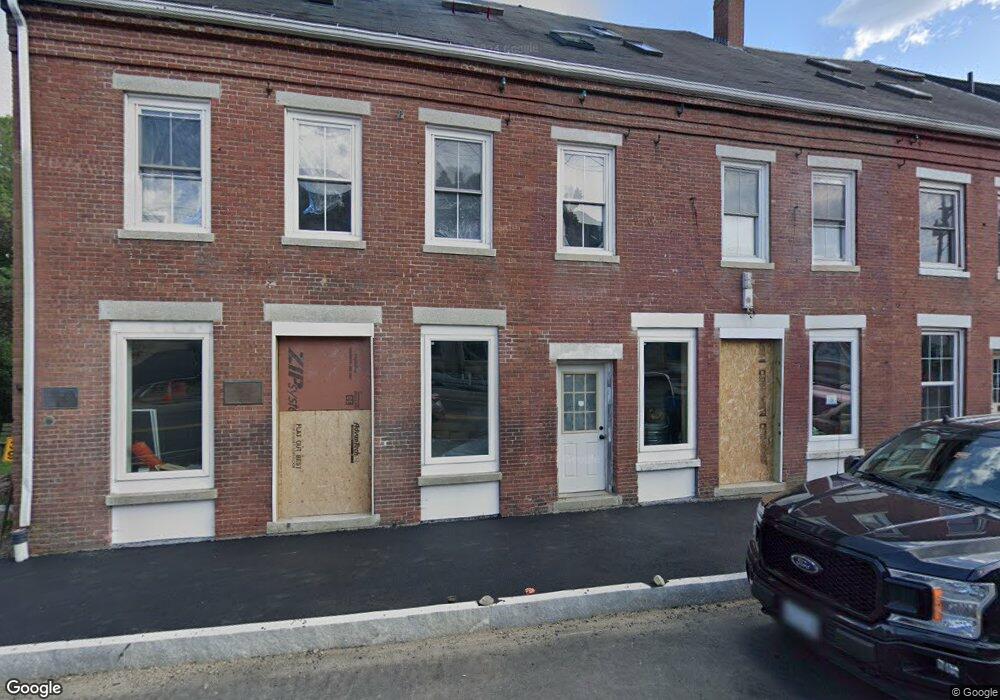
39 E Main St Searsport, ME 04974
Estimated Value: $313,000
--
Bed
5
Baths
--
Sq Ft
1,307
Sq Ft Lot
About This Home
This home is located at 39 E Main St, Searsport, ME 04974 and is currently estimated at $313,000. 39 E Main St is a home located in Waldo County.
Ownership History
Date
Name
Owned For
Owner Type
Purchase Details
Closed on
Mar 13, 2020
Sold by
Mclellan Edward and Mclellan Anita
Bought by
Pro Construction & Dev
Current Estimated Value
Home Financials for this Owner
Home Financials are based on the most recent Mortgage that was taken out on this home.
Original Mortgage
$70,000
Outstanding Balance
$61,995
Interest Rate
3.5%
Mortgage Type
New Conventional
Estimated Equity
$251,005
Purchase Details
Closed on
Jan 17, 2017
Sold by
Bayview Loan Svcing Llc
Bought by
Mclellan Anita and Mclellan Edward
Create a Home Valuation Report for This Property
The Home Valuation Report is an in-depth analysis detailing your home's value as well as a comparison with similar homes in the area
Home Values in the Area
Average Home Value in this Area
Purchase History
| Date | Buyer | Sale Price | Title Company |
|---|---|---|---|
| Pro Construction & Dev | -- | None Available | |
| Pro Construction & Dev | -- | None Available | |
| Mclellan Anita | $56,175 | -- |
Source: Public Records
Mortgage History
| Date | Status | Borrower | Loan Amount |
|---|---|---|---|
| Open | Pro Construction & Dev | $70,000 | |
| Closed | Pro Construction & Dev | $70,000 |
Source: Public Records
Tax History Compared to Growth
Tax History
| Year | Tax Paid | Tax Assessment Tax Assessment Total Assessment is a certain percentage of the fair market value that is determined by local assessors to be the total taxable value of land and additions on the property. | Land | Improvement |
|---|---|---|---|---|
| 2024 | $2,350 | $102,600 | $50,600 | $52,000 |
| 2023 | $2,073 | $102,600 | $50,600 | $52,000 |
| 2022 | $1,980 | $102,600 | $50,600 | $52,000 |
| 2021 | $1,939 | $102,600 | $50,600 | $52,000 |
| 2020 | $1,919 | $102,600 | $50,600 | $52,000 |
| 2019 | $1,898 | $102,600 | $50,600 | $52,000 |
| 2018 | $1,898 | $102,600 | $50,600 | $52,000 |
| 2017 | $2,975 | $122,940 | $36,700 | $86,240 |
| 2016 | $3,351 | $140,200 | $36,700 | $103,500 |
| 2015 | $3,323 | $140,200 | $36,700 | $103,500 |
| 2014 | $3,183 | $140,200 | $36,700 | $103,500 |
| 2013 | $3,014 | $140,200 | $36,700 | $103,500 |
Source: Public Records
Map
Nearby Homes