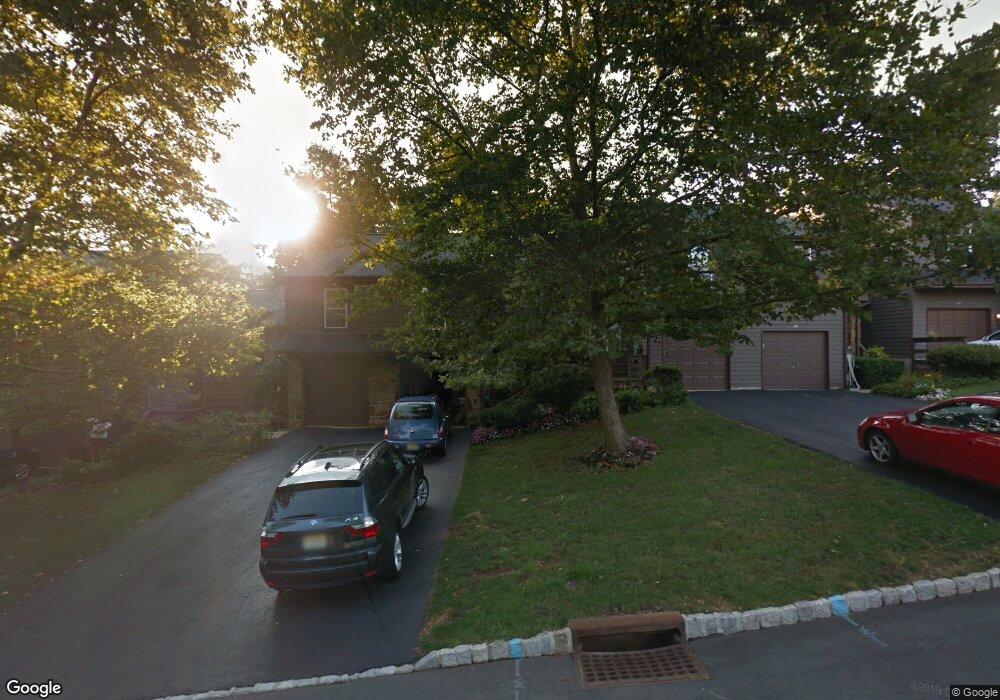
39 E Roxbury Ct Unit E Princeton, NJ 08540
Estimated Value: $499,086 - $559,000
2
Beds
3
Baths
1,463
Sq Ft
$361/Sq Ft
Est. Value
About This Home
This home is located at 39 E Roxbury Ct Unit E, Princeton, NJ 08540 and is currently estimated at $528,522, approximately $361 per square foot. 39 E Roxbury Ct Unit E is a home located in Somerset County with nearby schools including Orchard Hill Elementary School, Montgomery Lower Mid School, and Village Elementary School.
Ownership History
Date
Name
Owned For
Owner Type
Purchase Details
Closed on
Aug 19, 2008
Sold by
Larson Karen Ruth
Bought by
Pang Kimberly A
Current Estimated Value
Home Financials for this Owner
Home Financials are based on the most recent Mortgage that was taken out on this home.
Original Mortgage
$238,000
Outstanding Balance
$151,692
Interest Rate
5.75%
Mortgage Type
Purchase Money Mortgage
Estimated Equity
$376,830
Purchase Details
Closed on
Aug 6, 2002
Sold by
Hoffman Jason
Bought by
Mella James and Larson Karen
Purchase Details
Closed on
Jan 7, 2000
Sold by
Cooper Margaret
Bought by
Hoffman Jason
Home Financials for this Owner
Home Financials are based on the most recent Mortgage that was taken out on this home.
Original Mortgage
$149,600
Interest Rate
7.83%
Create a Home Valuation Report for This Property
The Home Valuation Report is an in-depth analysis detailing your home's value as well as a comparison with similar homes in the area
Home Values in the Area
Average Home Value in this Area
Purchase History
| Date | Buyer | Sale Price | Title Company |
|---|---|---|---|
| Pang Kimberly A | $280,000 | Multiple | |
| Mella James | $247,000 | -- | |
| Hoffman Jason | $157,500 | -- |
Source: Public Records
Mortgage History
| Date | Status | Borrower | Loan Amount |
|---|---|---|---|
| Open | Pang Kimberly A | $238,000 | |
| Previous Owner | Hoffman Jason | $149,600 |
Source: Public Records
Tax History Compared to Growth
Tax History
| Year | Tax Paid | Tax Assessment Tax Assessment Total Assessment is a certain percentage of the fair market value that is determined by local assessors to be the total taxable value of land and additions on the property. | Land | Improvement |
|---|---|---|---|---|
| 2025 | $9,235 | $269,400 | $192,400 | $77,000 |
| 2024 | $9,235 | $269,400 | $192,400 | $77,000 |
| 2023 | $9,222 | $269,400 | $192,400 | $77,000 |
| 2022 | $8,683 | $269,400 | $192,400 | $77,000 |
| 2021 | $8,607 | $269,400 | $192,400 | $77,000 |
| 2020 | $8,535 | $269,400 | $192,400 | $77,000 |
| 2019 | $8,475 | $269,400 | $192,400 | $77,000 |
| 2018 | $8,276 | $269,400 | $192,400 | $77,000 |
| 2017 | $8,149 | $269,400 | $192,400 | $77,000 |
| 2016 | $8,007 | $269,400 | $192,400 | $77,000 |
| 2015 | $7,829 | $269,400 | $192,400 | $77,000 |
| 2014 | $7,734 | $269,400 | $192,400 | $77,000 |
Source: Public Records
Map
Nearby Homes
- 36 -D Needham Way
- 36 Needham Way Unit D
- 8B Brookline Ct
- 8 -B Brookline Ct Unit B
- 100 Jackson Ave
- 23 Taft Ct
- 33 Kennedy Ct
- 20 Princeton Ave
- 37 Crescent Ave
- 231 Bertrand Dr
- 851 Mount Lucas Rd
- 835 Mount Lucas Rd
- 617 Mount Lucas Rd
- 1082 Princeton Kingston Rd
- 1082 Kingston Rd
- 108 Dogwood Hill
- 2 Washington St
- 36 Ross Stevenson Cir
- 10 Shaw Dr
- 119 Poe Rd
- 39E Roxbury Ct
- 39D Roxbury Ct Unit D
- 39D Roxbury Ct
- 39F Roxbury Ct Unit F
- 39F Roxbury Ct
- 39G Roxbury Ct
- 39C Roxbury Ct Unit C
- 39C Roxbury Ct
- 39 B Roxbury Ct
- 39B Roxbury Ct
- 39B Roxbury Ct Unit B
- 39 Roxbury Ct Unit F
- 39 Roxbury Ct Unit E
- 39 Roxbury Ct Unit B
- 39 Roxbury Ct Unit C
- 39 Roxbury Ct Unit D
- 39 Roxbury Ct Unit A
- 39 Roxbury Ct
- 39A Roxbury Ct
- 38 Chicopee Drive A