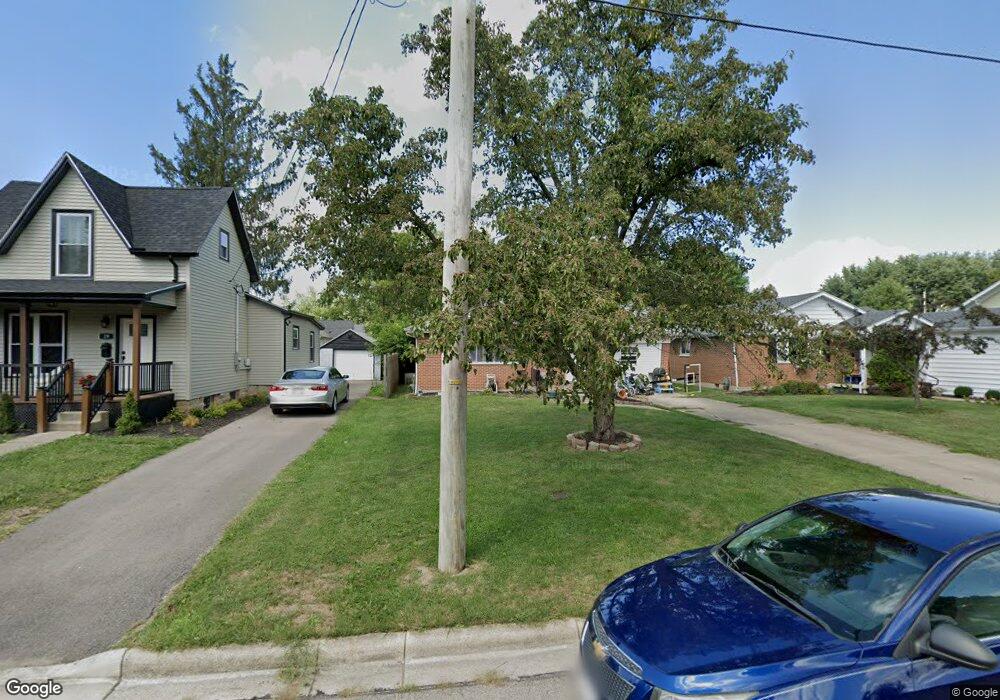
39 E Ruby Ave Wilmington, OH 45177
Estimated Value: $202,433 - $240,000
3
Beds
2
Baths
1,572
Sq Ft
$139/Sq Ft
Est. Value
About This Home
This home is located at 39 E Ruby Ave, Wilmington, OH 45177 and is currently estimated at $218,858, approximately $139 per square foot. 39 E Ruby Ave is a home located in Clinton County with nearby schools including East End Elementary School, Denver Place Elementary School, and Roy E. Holmes Elementary School.
Ownership History
Date
Name
Owned For
Owner Type
Purchase Details
Closed on
Oct 11, 2002
Sold by
Botts Joel C
Bought by
Blackburn Virginia L
Current Estimated Value
Home Financials for this Owner
Home Financials are based on the most recent Mortgage that was taken out on this home.
Original Mortgage
$72,000
Outstanding Balance
$29,137
Interest Rate
6.34%
Mortgage Type
New Conventional
Estimated Equity
$189,721
Purchase Details
Closed on
Jan 1, 1990
Bought by
Botts Joel C
Create a Home Valuation Report for This Property
The Home Valuation Report is an in-depth analysis detailing your home's value as well as a comparison with similar homes in the area
Home Values in the Area
Average Home Value in this Area
Purchase History
| Date | Buyer | Sale Price | Title Company |
|---|---|---|---|
| Blackburn Virginia L | $72,000 | -- | |
| Botts Joel C | -- | -- |
Source: Public Records
Mortgage History
| Date | Status | Borrower | Loan Amount |
|---|---|---|---|
| Open | Blackburn Virginia L | $72,000 |
Source: Public Records
Tax History
| Year | Tax Paid | Tax Assessment Tax Assessment Total Assessment is a certain percentage of the fair market value that is determined by local assessors to be the total taxable value of land and additions on the property. | Land | Improvement |
|---|---|---|---|---|
| 2025 | $1,726 | $53,200 | $6,510 | $46,690 |
| 2024 | $1,726 | $53,200 | $6,510 | $46,690 |
| 2023 | $1,786 | $53,200 | $6,510 | $46,690 |
| 2022 | $1,328 | $37,220 | $5,930 | $31,290 |
| 2021 | $1,344 | $37,220 | $5,930 | $31,290 |
| 2020 | $1,263 | $37,220 | $5,930 | $31,290 |
| 2019 | $1,094 | $29,430 | $6,340 | $23,090 |
| 2018 | $1,104 | $29,430 | $6,340 | $23,090 |
| 2017 | $536 | $29,430 | $6,340 | $23,090 |
| 2016 | $1,065 | $28,860 | $6,630 | $22,230 |
| 2015 | $1,048 | $28,860 | $6,630 | $22,230 |
| 2013 | $1,094 | $29,770 | $6,630 | $23,140 |
Source: Public Records
Map
Nearby Homes
- 906 N South St
- 978 N South St
- 977 N South St
- 996 N South St
- 966 N South St
- 660 Xenia Ave
- 18 E Kentucky Ave
- 570 N Walnut St
- 235 B St
- 125 E Kentucky Ave
- 256 Florence Ave
- 302 Lorish Ave
- 209 Chakeres Way
- 585 N Spring St
- 379 Virginia Cir
- 69 W Vine St
- 0 Mccoy Rd Unit 1761017
- 346 Virginia Cir
- 1216 N St Rt 134
- 0 S St Rt 73 Unit 1827681
Your Personal Tour Guide
Ask me questions while you tour the home.