Estimated Value: $1,450,999
5
Beds
5
Baths
1,320
Sq Ft
$1,099/Sq Ft
Est. Value
About This Home
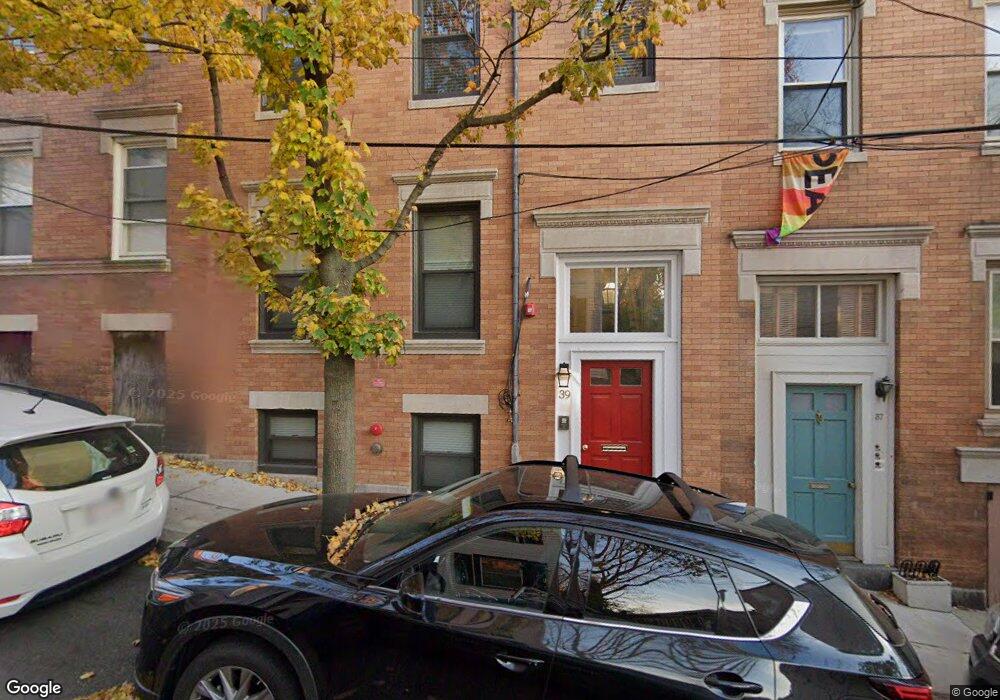
This home is located at 39 Eden St, Charlestown, MA 02129 and is currently estimated at $1,450,999, approximately $1,099 per square foot. 39 Eden St is a home located in Suffolk County with nearby schools including Prospect Hill Academy Upper Elementary Campus and Bright Future Educare Center.
Ownership History
Date
Name
Owned For
Owner Type
Purchase Details
Closed on
Jul 14, 2017
Sold by
Kendrick Llc
Bought by
Sweet Tiffany and Sweet Jereld
Current Estimated Value
Home Financials for this Owner
Home Financials are based on the most recent Mortgage that was taken out on this home.
Original Mortgage
$157,915
Outstanding Balance
$131,381
Interest Rate
3.94%
Mortgage Type
New Conventional
Estimated Equity
$1,319,618
Purchase Details
Closed on
Jul 23, 2015
Sold by
Ozer Steven R and Messina David
Bought by
Kendrick Llc
Create a Home Valuation Report for This Property
The Home Valuation Report is an in-depth analysis detailing your home's value as well as a comparison with similar homes in the area
Home Values in the Area
Average Home Value in this Area
Purchase History
| Date | Buyer | Sale Price | Title Company |
|---|---|---|---|
| Sweet Tiffany | $840,000 | -- | |
| Kendrick Llc | $850,000 | -- |
Source: Public Records
Mortgage History
| Date | Status | Borrower | Loan Amount |
|---|---|---|---|
| Open | Sweet Tiffany | $157,915 |
Source: Public Records
Tax History Compared to Growth
Tax History
| Year | Tax Paid | Tax Assessment Tax Assessment Total Assessment is a certain percentage of the fair market value that is determined by local assessors to be the total taxable value of land and additions on the property. | Land | Improvement |
|---|---|---|---|---|
| 2025 | $0 | $0 | $0 | $0 |
| 2024 | $0 | $0 | $0 | $0 |
| 2023 | $0 | $0 | $0 | $0 |
| 2022 | $17,392 | $0 | $0 | $0 |
| 2021 | $0 | $0 | $0 | $0 |
| 2020 | $0 | $0 | $0 | $0 |
| 2019 | $17,392 | $0 | $0 | $0 |
| 2018 | $17,392 | $1,659,500 | $202,000 | $1,457,500 |
| 2017 | $1,973 | $795,600 | $202,000 | $593,600 |
| 2016 | $7,894 | $717,600 | $202,000 | $515,600 |
| 2015 | $7,328 | $605,100 | $192,500 | $412,600 |
| 2014 | $6,782 | $539,100 | $192,500 | $346,600 |
Source: Public Records
Map
Nearby Homes
- 40 Mead St Unit 3
- 29 Eden St Unit 3
- 64 Walker St Unit 66
- 364 Bunker Hill St Unit 1
- 24 N Mead St
- 270 Bunker Hill St Unit 4
- 15 Russell St
- 255 Bunker Hill St Unit 2
- 9 Armory St
- 9 Russell St Unit 2
- 9 Russell St Unit 1
- 56 Belmont St Unit 1
- 247 Bunker Hill St Unit A
- 40 Chappie St Unit 1
- 100 Baldwin St Unit 1
- 9 Short St
- 207 Bunker Hill St Unit 2
- 254-256 Medford St Unit 2
- 172 Bunker Hill St Unit 1
- 56 High St Unit 3
- 41 Eden St
- 41 Eden St
- 41 Eden St Unit 1
- 41 Eden St Unit 2
- 41 Eden St Unit 3
- 70 Russell St Unit 2
- 70 Russell St
- 39 Eden St Unit 2
- 39 Eden St Unit 3
- 39 Eden St Unit 1
- 39 Eden St
- 43 Eden St
- 68 Russell St Unit 4
- 68 Russell St Unit 3
- 68 Russell St Unit 2
- 68 Russell St Unit 1
- 35 Eden St Unit 37
- 37 Eden St Unit 2
- 37 Eden St Unit 1
- 37 Eden St