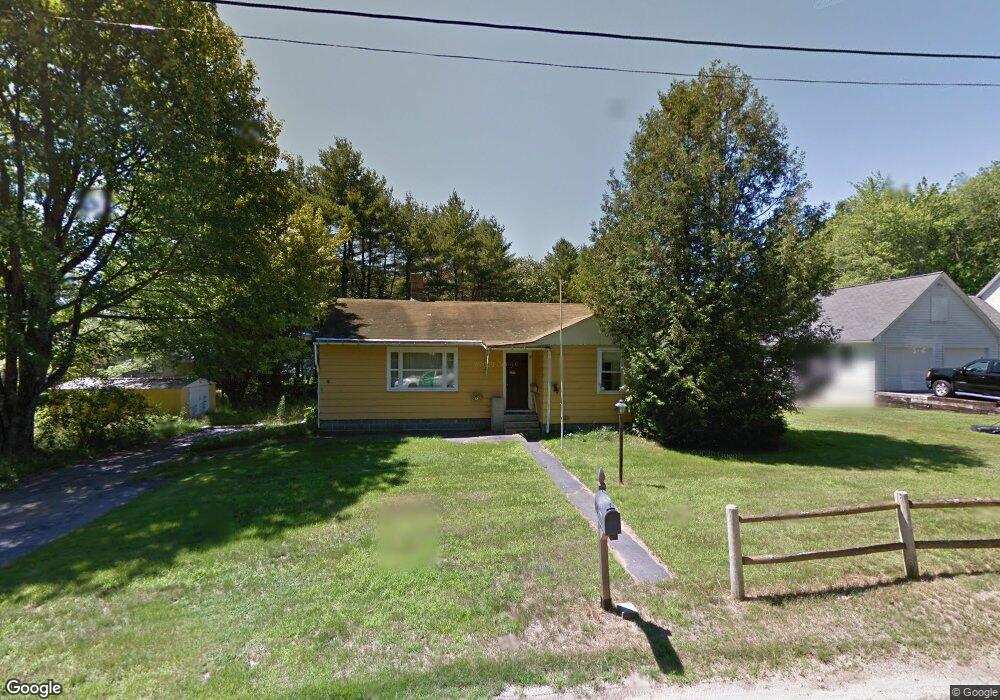
39 Edgecomb Rd Lisbon Falls, ME 04252
Estimated Value: $284,000 - $376,000
3
Beds
1
Bath
1,115
Sq Ft
$278/Sq Ft
Est. Value
About This Home
This home is located at 39 Edgecomb Rd, Lisbon Falls, ME 04252 and is currently estimated at $310,435, approximately $278 per square foot. 39 Edgecomb Rd is a home located in Androscoggin County with nearby schools including Lisbon Community School, Philip W. Sugg Middle School, and Lisbon High School.
Ownership History
Date
Name
Owned For
Owner Type
Purchase Details
Closed on
Oct 7, 2022
Sold by
Reynolds Louise M
Bought by
Mauro Sandy J and Mauro Brian R
Current Estimated Value
Home Financials for this Owner
Home Financials are based on the most recent Mortgage that was taken out on this home.
Original Mortgage
$65,000
Outstanding Balance
$61,911
Interest Rate
5.55%
Mortgage Type
Purchase Money Mortgage
Estimated Equity
$248,524
Purchase Details
Closed on
Dec 19, 2013
Sold by
Msha
Bought by
Reynolds James and Reynolds Louise
Home Financials for this Owner
Home Financials are based on the most recent Mortgage that was taken out on this home.
Original Mortgage
$49,600
Interest Rate
4.15%
Mortgage Type
New Conventional
Purchase Details
Closed on
Sep 12, 2008
Sold by
Hammond James C
Bought by
Richter Kevin D
Home Financials for this Owner
Home Financials are based on the most recent Mortgage that was taken out on this home.
Original Mortgage
$103,000
Interest Rate
6.58%
Mortgage Type
Purchase Money Mortgage
Create a Home Valuation Report for This Property
The Home Valuation Report is an in-depth analysis detailing your home's value as well as a comparison with similar homes in the area
Home Values in the Area
Average Home Value in this Area
Purchase History
| Date | Buyer | Sale Price | Title Company |
|---|---|---|---|
| Mauro Sandy J | -- | None Available | |
| Reynolds James | -- | -- | |
| Reynolds James | -- | -- | |
| Richter Kevin D | -- | -- |
Source: Public Records
Mortgage History
| Date | Status | Borrower | Loan Amount |
|---|---|---|---|
| Open | Mauro Sandy J | $65,000 | |
| Previous Owner | Reynolds James | $49,600 | |
| Previous Owner | Richter Kevin D | $103,000 |
Source: Public Records
Tax History
| Year | Tax Paid | Tax Assessment Tax Assessment Total Assessment is a certain percentage of the fair market value that is determined by local assessors to be the total taxable value of land and additions on the property. | Land | Improvement |
|---|---|---|---|---|
| 2024 | $2,709 | $199,200 | $57,100 | $142,100 |
| 2023 | $2,386 | $113,100 | $37,700 | $75,400 |
| 2022 | $2,613 | $113,100 | $37,700 | $75,400 |
| 2021 | $2,500 | $113,100 | $37,700 | $75,400 |
| 2020 | $2,613 | $113,100 | $37,700 | $75,400 |
| 2019 | $2,613 | $113,100 | $37,700 | $75,400 |
| 2018 | $2,479 | $99,800 | $32,800 | $67,000 |
| 2017 | $2,315 | $99,800 | $32,800 | $67,000 |
| 2016 | $2,236 | $99,800 | $32,800 | $67,000 |
| 2015 | $2,272 | $96,300 | $25,200 | $71,100 |
| 2014 | $2,350 | $96,300 | $25,200 | $71,100 |
| 2013 | -- | $96,300 | $25,200 | $71,100 |
Source: Public Records
Map
Nearby Homes
Your Personal Tour Guide
Ask me questions while you tour the home.