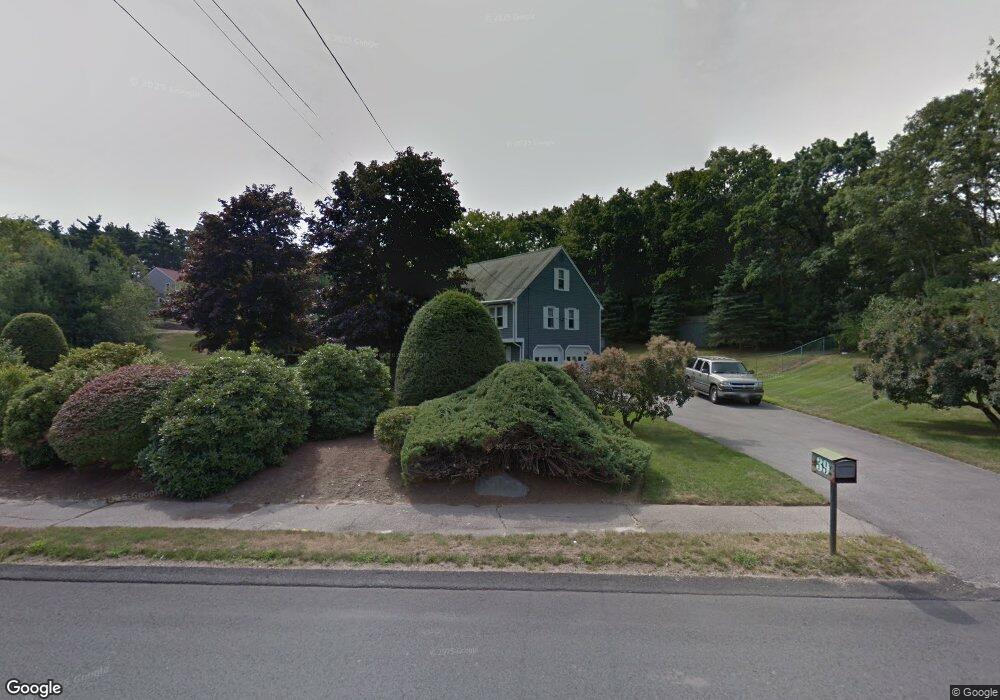
39 Edwards Rd Foxboro, MA 02035
Estimated Value: $713,000 - $1,071,000
4
Beds
4
Baths
1,699
Sq Ft
$502/Sq Ft
Est. Value
About This Home
This home is located at 39 Edwards Rd, Foxboro, MA 02035 and is currently estimated at $852,567, approximately $501 per square foot. 39 Edwards Rd is a home located in Norfolk County with nearby schools including Foxborough High School, Foxborough Regional Charter School, and The Sage School.
Ownership History
Date
Name
Owned For
Owner Type
Purchase Details
Closed on
Oct 11, 2023
Sold by
Abdalah Julie M
Bought by
Abdalah Rt and Abdalah
Current Estimated Value
Purchase Details
Closed on
Jul 30, 2014
Sold by
Parisella Julie M and Abdalah Julie M
Bought by
Abdalah Julie M and Abdalah Ernest G
Home Financials for this Owner
Home Financials are based on the most recent Mortgage that was taken out on this home.
Original Mortgage
$233,400
Interest Rate
4.18%
Mortgage Type
New Conventional
Purchase Details
Closed on
Jun 30, 1995
Sold by
Hadge Robert J and Hadge Antonette L
Bought by
Parisella Julie M
Home Financials for this Owner
Home Financials are based on the most recent Mortgage that was taken out on this home.
Original Mortgage
$140,000
Interest Rate
7.8%
Mortgage Type
Purchase Money Mortgage
Purchase Details
Closed on
May 23, 1991
Sold by
Hadge Donald M and Hadge Patricia A
Bought by
Hadge Robt J and Hadge Antonette L
Create a Home Valuation Report for This Property
The Home Valuation Report is an in-depth analysis detailing your home's value as well as a comparison with similar homes in the area
Home Values in the Area
Average Home Value in this Area
Purchase History
| Date | Buyer | Sale Price | Title Company |
|---|---|---|---|
| Abdalah Rt | -- | None Available | |
| Abdalah Julie M | -- | -- | |
| Parisella Julie M | $220,000 | -- | |
| Hadge Robt J | $190,000 | -- |
Source: Public Records
Mortgage History
| Date | Status | Borrower | Loan Amount |
|---|---|---|---|
| Previous Owner | Abdalah Julie M | $233,400 | |
| Previous Owner | Hadge Robt J | $140,000 | |
| Previous Owner | Hadge Robt J | $137,000 | |
| Previous Owner | Hadge Robt J | $15,000 |
Source: Public Records
Tax History
| Year | Tax Paid | Tax Assessment Tax Assessment Total Assessment is a certain percentage of the fair market value that is determined by local assessors to be the total taxable value of land and additions on the property. | Land | Improvement |
|---|---|---|---|---|
| 2025 | $9,164 | $693,200 | $288,200 | $405,000 |
| 2024 | $8,757 | $648,200 | $293,400 | $354,800 |
| 2023 | $8,499 | $598,100 | $279,600 | $318,500 |
| 2022 | $7,094 | $488,600 | $234,600 | $254,000 |
| 2021 | $6,730 | $456,600 | $217,200 | $239,400 |
| 2020 | $6,653 | $456,600 | $217,200 | $239,400 |
| 2019 | $6,722 | $457,300 | $206,800 | $250,500 |
| 2018 | $6,360 | $436,500 | $206,800 | $229,700 |
| 2017 | $6,048 | $402,100 | $193,200 | $208,900 |
| 2016 | $6,424 | $433,500 | $194,900 | $238,600 |
| 2015 | $6,128 | $403,400 | $164,800 | $238,600 |
| 2014 | $5,878 | $392,100 | $154,000 | $238,100 |
Source: Public Records
Map
Nearby Homes
- 120 Beach St
- 73 Ridge Rd
- 1 Maura Elizabeth Ln
- 180 Old Post Rd Unit 202
- 180 Old Post Rd Unit 206
- 180 Old Post Rd Unit 308
- 180 Old Post Rd Unit 201
- 180 Old Post Rd Unit 405
- 180 Old Post Rd Unit 207
- 668 S Main St
- 260 Summer St
- 147 Chestnut St Unit A
- 147 Chestnut St Unit B
- 16R Eldor Dr
- 1549 Washington St Unit A
- 165 Chestnut St Unit 2
- 3 Stone Hill Terrace
- 54 Main St Unit A
- 14 Baker St
- 5 Post Rd
Your Personal Tour Guide
Ask me questions while you tour the home.