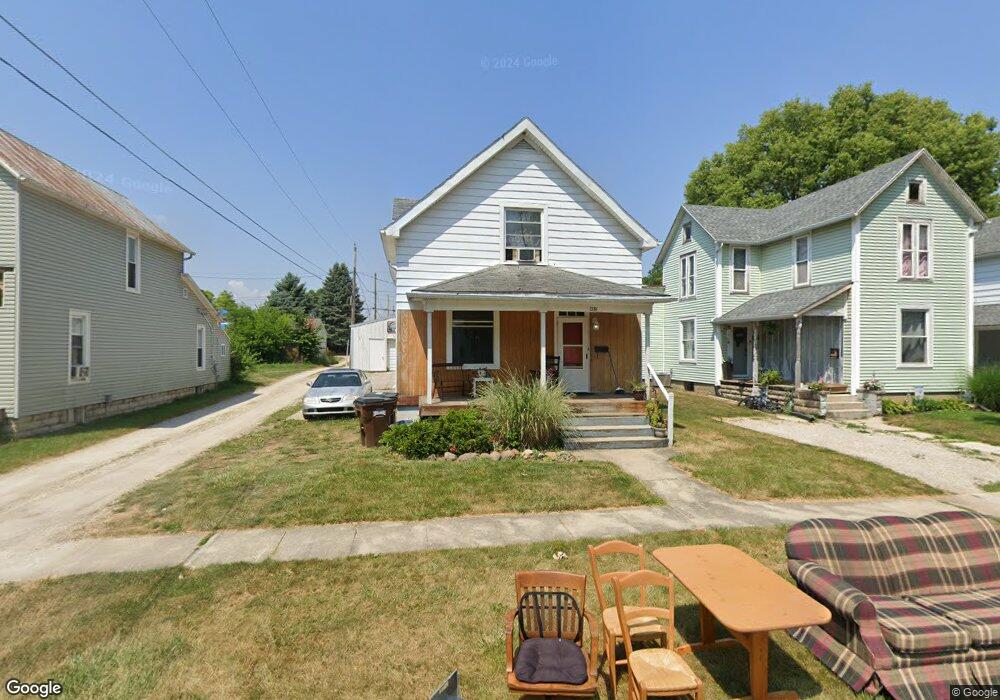
39 Erie St Tiffin, OH 44883
Estimated Value: $118,000 - $129,000
2
Beds
2
Baths
1,078
Sq Ft
$113/Sq Ft
Est. Value
About This Home
This home is located at 39 Erie St, Tiffin, OH 44883 and is currently estimated at $122,352, approximately $113 per square foot. 39 Erie St is a home with nearby schools including Columbian High School, Calvert Catholic Elementary School, and Calvert High School.
Ownership History
Date
Name
Owned For
Owner Type
Purchase Details
Closed on
Oct 25, 2010
Sold by
Neikirk Vicki S and Neikirk Philip L
Bought by
Vp Rentals Inc
Current Estimated Value
Purchase Details
Closed on
Nov 26, 2007
Sold by
Neikirk Philip L
Bought by
Neikirk Vickie S
Purchase Details
Closed on
Jan 21, 2003
Sold by
Mehling Danny T
Bought by
Neikirk Phil
Purchase Details
Closed on
Nov 19, 1993
Sold by
Snyder Margaret
Bought by
Mehling Danny T
Purchase Details
Closed on
Sep 30, 1991
Sold by
Zoeller Dennis
Bought by
Snyder Margaret
Purchase Details
Closed on
Nov 1, 1988
Create a Home Valuation Report for This Property
The Home Valuation Report is an in-depth analysis detailing your home's value as well as a comparison with similar homes in the area
Home Values in the Area
Average Home Value in this Area
Purchase History
| Date | Buyer | Sale Price | Title Company |
|---|---|---|---|
| Vp Rentals Inc | -- | None Available | |
| Neikirk Vickie S | -- | None Available | |
| Neikirk Phil | $64,000 | -- | |
| Mehling Danny T | $40,000 | -- | |
| Snyder Margaret | $32,500 | -- | |
| -- | $25,000 | -- |
Source: Public Records
Tax History Compared to Growth
Tax History
| Year | Tax Paid | Tax Assessment Tax Assessment Total Assessment is a certain percentage of the fair market value that is determined by local assessors to be the total taxable value of land and additions on the property. | Land | Improvement |
|---|---|---|---|---|
| 2024 | $896 | $25,920 | $5,760 | $20,160 |
| 2023 | $897 | $25,920 | $5,760 | $20,160 |
| 2022 | $843 | $20,210 | $4,620 | $15,590 |
| 2021 | $849 | $20,210 | $4,620 | $15,590 |
| 2020 | $865 | $20,213 | $4,624 | $15,589 |
| 2019 | $872 | $19,699 | $4,610 | $15,089 |
| 2018 | $874 | $19,699 | $4,610 | $15,089 |
| 2017 | $1,046 | $19,699 | $4,610 | $15,089 |
| 2016 | $809 | $18,495 | $4,470 | $14,025 |
| 2015 | $801 | $18,495 | $4,470 | $14,025 |
| 2014 | $755 | $18,495 | $4,470 | $14,025 |
| 2013 | $962 | $19,027 | $4,610 | $14,417 |
Source: Public Records
Map
Nearby Homes