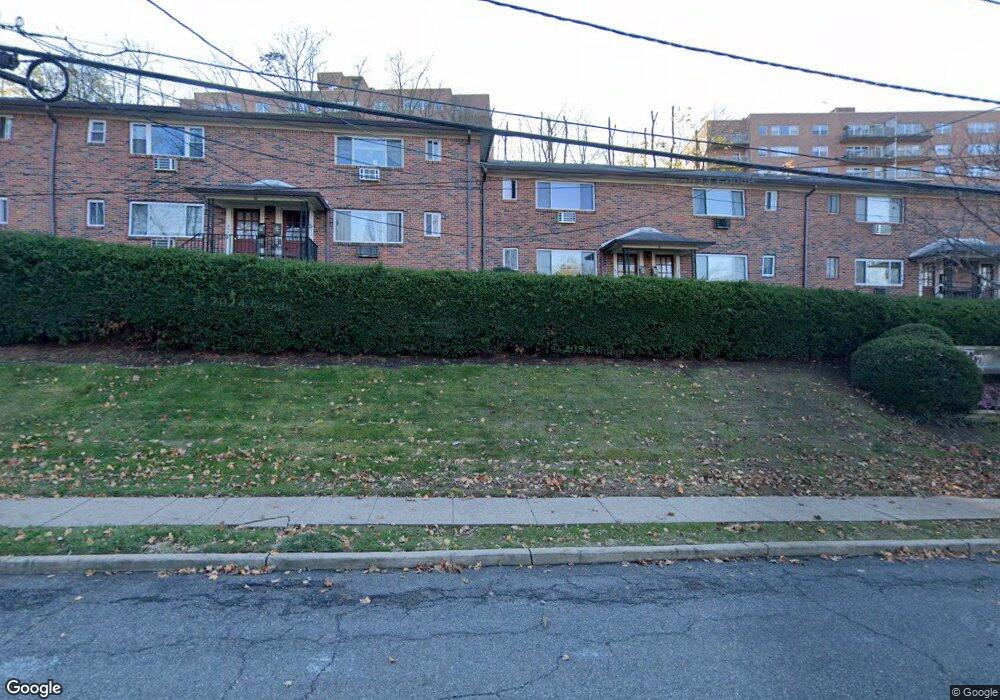
39 Espy Rd Unit C008B Caldwell, NJ 07006
Estimated Value: $288,088 - $379,000
Studio
--
Bath
739
Sq Ft
$448/Sq Ft
Est. Value
About This Home
This home is located at 39 Espy Rd Unit C008B, Caldwell, NJ 07006 and is currently estimated at $331,272, approximately $448 per square foot. 39 Espy Rd Unit C008B is a home located in Essex County with nearby schools including Washington Elementary School, James Caldwell High School, and Trinity Academy.
Ownership History
Date
Name
Owned For
Owner Type
Purchase Details
Closed on
Nov 30, 2004
Sold by
Zamora Devin
Bought by
Felton Kara
Current Estimated Value
Home Financials for this Owner
Home Financials are based on the most recent Mortgage that was taken out on this home.
Original Mortgage
$225,150
Outstanding Balance
$112,004
Interest Rate
5.63%
Estimated Equity
$219,268
Purchase Details
Closed on
Jul 28, 2004
Sold by
O'connell Robert
Bought by
Zamora Devin
Home Financials for this Owner
Home Financials are based on the most recent Mortgage that was taken out on this home.
Original Mortgage
$203,400
Interest Rate
6.2%
Purchase Details
Closed on
Dec 30, 1999
Sold by
Metroplitan Condominium
Bought by
O'connell Robert
Home Financials for this Owner
Home Financials are based on the most recent Mortgage that was taken out on this home.
Original Mortgage
$84,550
Interest Rate
7.84%
Create a Home Valuation Report for This Property
The Home Valuation Report is an in-depth analysis detailing your home's value as well as a comparison with similar homes in the area
Home Values in the Area
Average Home Value in this Area
Purchase History
We collect this data history from publicly available records. To have your information removed, we recommend requesting removal directly through your county’s website.
| Date | Buyer | Sale Price | Title Company |
|---|---|---|---|
| Felton Kara | $237,000 | -- | |
| Zamora Devin | $226,000 | -- | |
| O'connell Robert | $89,000 | -- |
Source: Public Records
Mortgage History
We collect this data history from publicly available records. To have your information removed, we recommend requesting removal directly through your county’s website.
| Date | Status | Borrower | Loan Amount |
|---|---|---|---|
| Open | Felton Kara | $225,150 | |
| Previous Owner | Zamora Devin | $203,400 | |
| Previous Owner | O'connell Robert | $84,550 |
Source: Public Records
Tax History
| Year | Tax Paid | Tax Assessment Tax Assessment Total Assessment is a certain percentage of the fair market value that is determined by local assessors to be the total taxable value of land and additions on the property. | Land | Improvement |
|---|---|---|---|---|
| 2025 | $5,371 | $168,700 | $90,000 | $78,700 |
| 2024 | $5,233 | $168,700 | $90,000 | $78,700 |
| 2022 | $5,100 | $168,700 | $90,000 | $78,700 |
| 2021 | $4,855 | $168,700 | $90,000 | $78,700 |
| 2020 | $4,729 | $168,700 | $90,000 | $78,700 |
| 2019 | $4,707 | $168,700 | $90,000 | $78,700 |
| 2018 | $4,584 | $168,700 | $90,000 | $78,700 |
| 2017 | $4,491 | $168,700 | $90,000 | $78,700 |
| 2016 | $5,288 | $195,000 | $100,000 | $95,000 |
| 2015 | $5,045 | $195,000 | $100,000 | $95,000 |
| 2014 | $4,725 | $195,000 | $100,000 | $95,000 |
Source: Public Records
Map
Nearby Homes
- 36 Espy Rd
- 34 Espy Rd
- 37 Espy Rd Unit 6B
- 27 Espy Rd Unit A7
- 14 Espy Rd
- 7 Central Ave
- 56 Central Ave
- 17 Lane Ave
- 122 Westover Ave
- 580 Bloomfield Ave Unit 11B
- 12 Elmwood Terrace
- 83 Westville Ave
- 169 Central Ave
- 17 Westover Terrace
- 15 Woodrow Place
- 10 Laurel Place
- 50 Brookside Ave
- 63 Roseland Ave Unit 47
- 66 Elmwood Terrace
- 91 Roseland Ave Unit C7
- 40 Espy Rd
- 33 Espy Rd C003a Unit 3A
- 32 Espy Rd
- 42 Espy Rd
- 32 Ravine Ave
- 30 Ravine Ave
- 34 Ravine Ave
- 39 Espy Rd C009b
- 39 Espy Rd C009a Unit 9A
- 35 Espy Rd Unit C005A
- 35 Espy Rd Unit C004A
- 35 Espy Rd Unit C005B
- 35 Espy Rd Unit C004B
- 35 Espy Rd Unit 4B
- 35 Espy Rd Unit 4A
- 33 Espy Rd Unit C003A
- 33 Espy Rd Unit C002B
- 33 Espy Rd Unit C002A
- 33 Espy Rd Unit C003B
- 33 Espy Rd Unit 33B
Your Personal Tour Guide
Ask me questions while you tour the home.