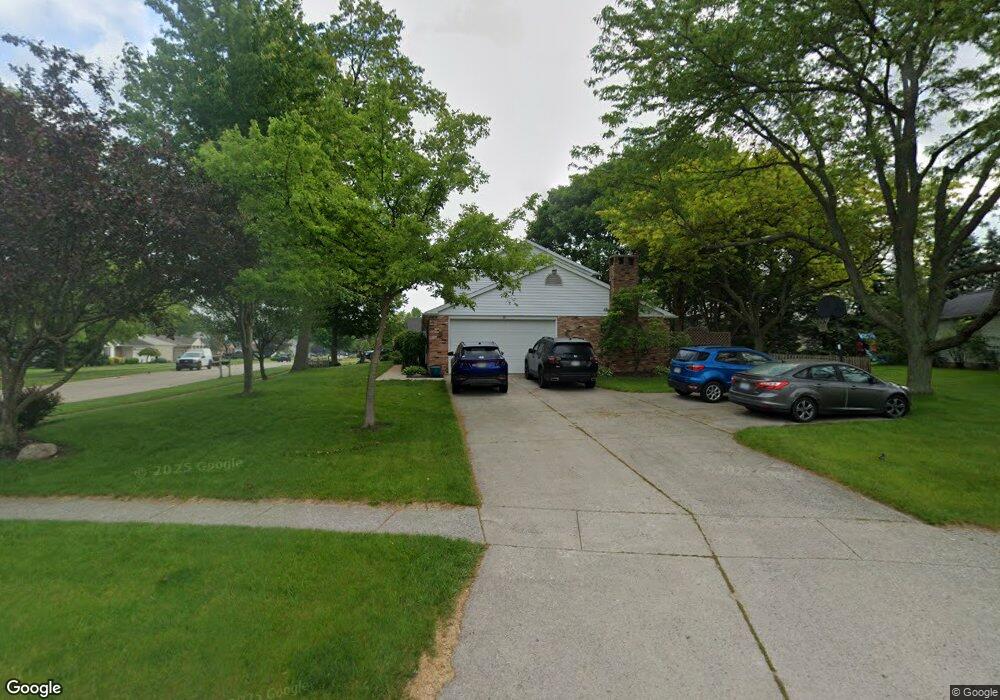
39 Executive Dr Norwalk, OH 44857
Estimated Value: $323,000 - $399,000
4
Beds
2
Baths
2,562
Sq Ft
$141/Sq Ft
Est. Value
About This Home
This home is located at 39 Executive Dr, Norwalk, OH 44857 and is currently estimated at $361,456, approximately $141 per square foot. 39 Executive Dr is a home located in Huron County with nearby schools including Maplehurst Elementary School, Pleasant Elementary School, and League Elementary School.
Ownership History
Date
Name
Owned For
Owner Type
Purchase Details
Closed on
Jun 9, 2003
Bought by
Depinet Paul J and Depinet Monica A
Current Estimated Value
Purchase Details
Closed on
Oct 17, 1994
Sold by
Bishop Mark S
Bought by
Ebling Steven J and Ebling Dianne
Home Financials for this Owner
Home Financials are based on the most recent Mortgage that was taken out on this home.
Original Mortgage
$115,000
Interest Rate
5.75%
Mortgage Type
New Conventional
Create a Home Valuation Report for This Property
The Home Valuation Report is an in-depth analysis detailing your home's value as well as a comparison with similar homes in the area
Home Values in the Area
Average Home Value in this Area
Purchase History
| Date | Buyer | Sale Price | Title Company |
|---|---|---|---|
| Depinet Paul J | $195,000 | -- | |
| Ebling Steven J | $160,000 | -- | |
| Ebling Steven J | $160,000 | -- |
Source: Public Records
Mortgage History
| Date | Status | Borrower | Loan Amount |
|---|---|---|---|
| Previous Owner | Ebling Steven J | $115,000 |
Source: Public Records
Tax History
| Year | Tax Paid | Tax Assessment Tax Assessment Total Assessment is a certain percentage of the fair market value that is determined by local assessors to be the total taxable value of land and additions on the property. | Land | Improvement |
|---|---|---|---|---|
| 2024 | $4,090 | $99,860 | $13,550 | $86,310 |
| 2023 | $4,075 | $75,190 | $9,590 | $65,600 |
| 2022 | $3,030 | $75,190 | $9,590 | $65,600 |
| 2021 | $3,032 | $75,190 | $9,590 | $65,600 |
| 2020 | $3,156 | $74,440 | $9,590 | $64,850 |
| 2019 | $3,086 | $74,440 | $9,590 | $64,850 |
| 2018 | $3,032 | $74,440 | $9,590 | $64,850 |
| 2017 | $3,052 | $74,670 | $9,590 | $65,080 |
| 2016 | $2,995 | $74,670 | $9,590 | $65,080 |
| 2015 | $2,994 | $74,680 | $9,590 | $65,090 |
| 2014 | $2,820 | $69,760 | $9,590 | $60,170 |
| 2013 | $2,451 | $69,760 | $9,590 | $60,170 |
Source: Public Records
Map
Nearby Homes
- 20 James St
- 431 Old State Rd S
- 40 Pitt St
- 202 Old State Rd S
- 18 Homewood Ave
- 15 Pitt St
- 1 Pitt St
- 6 Macintosh Rd
- 250 Woodlawn Ave
- 2 Scarlett Queen Dr
- 11 Granny Smith St
- 123 E Main St
- 0 Cleveland Rd
- 0 Ohio 18 Unit 20260823
- 18 Old Orchard Loop
- 2961 Ridge Rd
- 27 Whitefield Blvd
- 15 Minard Place
- 27 Eagle Creek Dr
- 104 Leisure Ln
- 41 Executive Dr
- 2 Joel Way
- 37 Executive Dr
- 43 Executive Dr
- 1 Gerard Dr
- 4 Joel Way
- 38 Executive Dr
- 1 Joel Way
- 3 Gerard Dr
- 0 Executive Dr Unit 3666017
- 0 Executive Dr Unit 20141975
- 0 Executive Dr Unit 20141674
- 0 Executive Dr Unit 20123854
- 0 Executive Dr Unit 20130139
- 0 Executive Dr Unit 20102563
- 0 Executive Dr Unit 904437
- 0 Executive Dr Unit 804918
- 35 Executive Dr
- 6 Joel Way
- 3 Joel Way
Your Personal Tour Guide
Ask me questions while you tour the home.