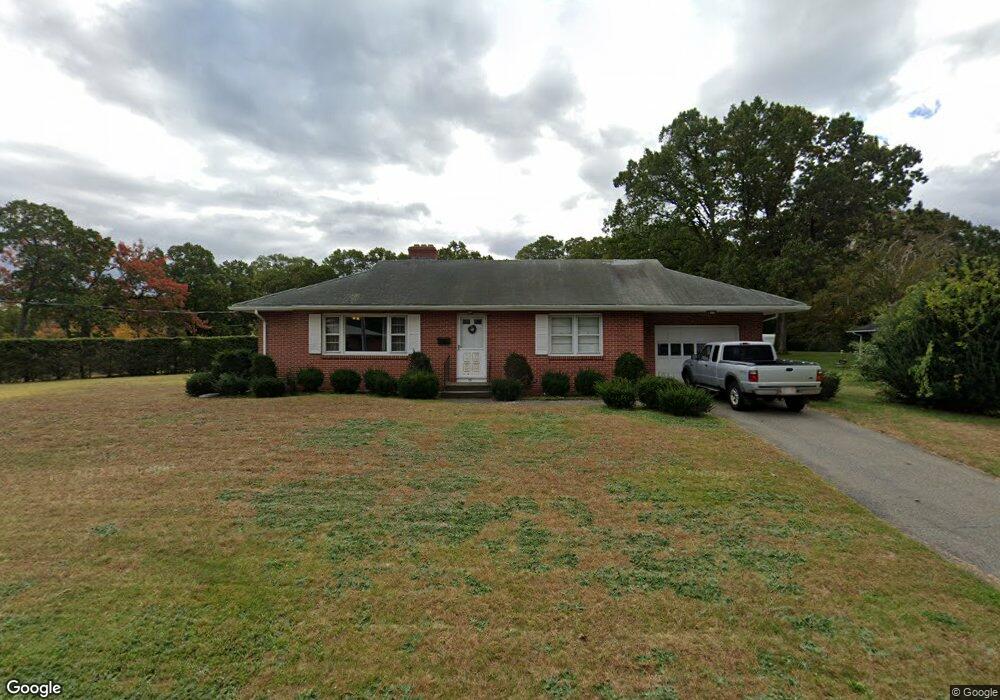
39 Fanjoy Dr Chicopee, MA 01013
Chicopee Center NeighborhoodEstimated Value: $233,000 - $313,216
2
Beds
1
Bath
960
Sq Ft
$283/Sq Ft
Est. Value
About This Home
This home is located at 39 Fanjoy Dr, Chicopee, MA 01013 and is currently estimated at $271,554, approximately $282 per square foot. 39 Fanjoy Dr is a home located in Hampden County with nearby schools including Bowe Elementary School, Fairview Middle School, and Chicopee High School.
Ownership History
Date
Name
Owned For
Owner Type
Purchase Details
Closed on
Oct 28, 2024
Sold by
Golen Joseph A
Bought by
Borek Stanislaw and Borek Helena
Current Estimated Value
Purchase Details
Closed on
Aug 11, 2006
Sold by
Golen Mildred A
Bought by
Golen Joseph A
Create a Home Valuation Report for This Property
The Home Valuation Report is an in-depth analysis detailing your home's value as well as a comparison with similar homes in the area
Home Values in the Area
Average Home Value in this Area
Purchase History
| Date | Buyer | Sale Price | Title Company |
|---|---|---|---|
| Borek Stanislaw | $220,000 | None Available | |
| Borek Stanislaw | $220,000 | None Available | |
| Golen Joseph A | -- | -- | |
| Golen Joseph A | -- | -- |
Source: Public Records
Mortgage History
| Date | Status | Borrower | Loan Amount |
|---|---|---|---|
| Previous Owner | Golen Joseph A | $95,750 | |
| Previous Owner | Golen Joseph A | $40,000 | |
| Previous Owner | Golen Joseph A | $40,000 | |
| Previous Owner | Golen Joseph A | $26,000 |
Source: Public Records
Tax History Compared to Growth
Tax History
| Year | Tax Paid | Tax Assessment Tax Assessment Total Assessment is a certain percentage of the fair market value that is determined by local assessors to be the total taxable value of land and additions on the property. | Land | Improvement |
|---|---|---|---|---|
| 2025 | $4,481 | $295,600 | $104,100 | $191,500 |
| 2024 | $4,255 | $288,300 | $102,100 | $186,200 |
| 2023 | $3,966 | $261,800 | $92,800 | $169,000 |
| 2022 | $3,816 | $224,600 | $80,700 | $143,900 |
| 2021 | $3,702 | $210,200 | $73,300 | $136,900 |
| 2020 | $3,522 | $201,700 | $73,300 | $128,400 |
| 2019 | $3,477 | $193,600 | $73,300 | $120,300 |
| 2018 | $3,159 | $186,000 | $69,800 | $116,200 |
| 2017 | $3,159 | $182,500 | $69,800 | $112,700 |
| 2016 | $3,105 | $183,600 | $69,800 | $113,800 |
| 2015 | $3,280 | $187,000 | $69,800 | $117,200 |
| 2014 | $1,640 | $187,000 | $69,800 | $117,200 |
Source: Public Records
Map
Nearby Homes
- 320 Fairview Ave
- 231 Wheatland Ave
- 26 Leeds St
- 85 Orchard St
- 528 Broadway St
- 92 Archie St
- 30 Athol St
- 2 Marion St
- 438 Front St
- Lot 1 Marion St
- 57- 59 Stearns Terrace
- 1078 Liberty St
- 24 Edmund St
- 572 Springfield St
- 195 Mildred Ave
- 11 Calvin St
- 596-598 Newbury St
- 92 Nonotuck Ave
- 193 Roy St
- 95 Washington St