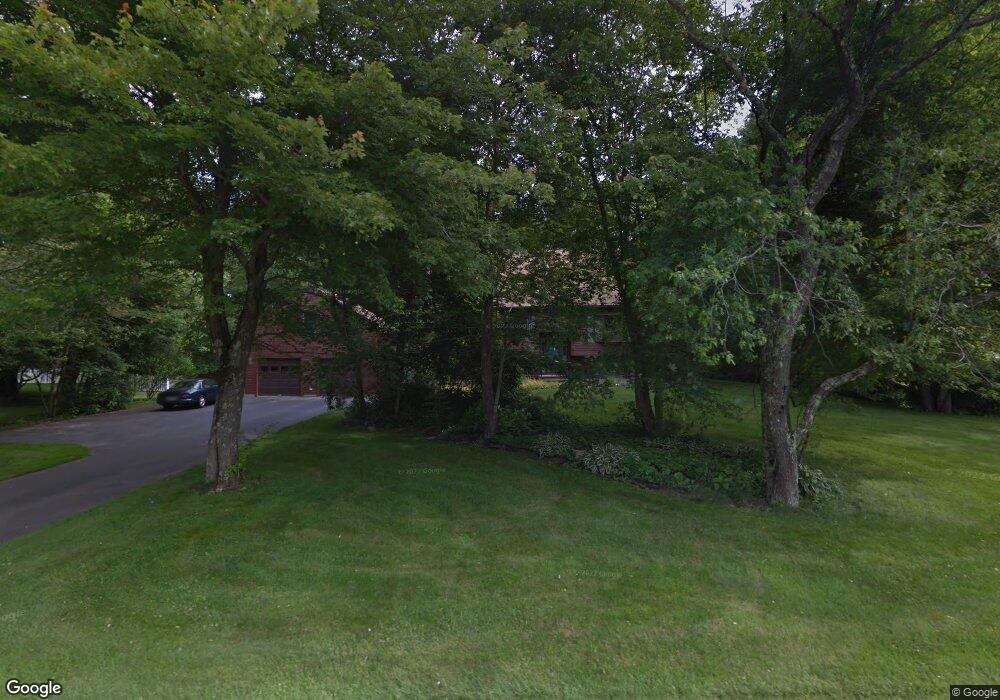
39 Fieldcrest Dr East Bridgewater, MA 02333
Estimated Value: $702,558 - $901,000
4
Beds
3
Baths
2,148
Sq Ft
$364/Sq Ft
Est. Value
About This Home
This home is located at 39 Fieldcrest Dr, East Bridgewater, MA 02333 and is currently estimated at $781,890, approximately $364 per square foot. 39 Fieldcrest Dr is a home located in Plymouth County with nearby schools including Central Elementary School, Gordon W Mitchell Middle School, and East Bridgewater Jr./Sr. High School.
Ownership History
Date
Name
Owned For
Owner Type
Purchase Details
Closed on
May 1, 2024
Sold by
Oneil Dennis M and Oneil Catherine A
Bought by
Fieldcrest Dr T and Fieldcrest Oneil
Current Estimated Value
Purchase Details
Closed on
Aug 15, 1989
Sold by
Foxglove Rt
Bought by
Oneil Dennis M
Create a Home Valuation Report for This Property
The Home Valuation Report is an in-depth analysis detailing your home's value as well as a comparison with similar homes in the area
Home Values in the Area
Average Home Value in this Area
Purchase History
| Date | Buyer | Sale Price | Title Company |
|---|---|---|---|
| Fieldcrest Dr T | -- | None Available | |
| Fieldcrest Dr T | -- | None Available | |
| Oneil Dennis M | $229,500 | -- | |
| Oneil Dennis M | $229,500 | -- |
Source: Public Records
Mortgage History
| Date | Status | Borrower | Loan Amount |
|---|---|---|---|
| Previous Owner | Oneil Dennis M | $197,668 | |
| Previous Owner | Oneil Dennis M | $209,759 | |
| Previous Owner | Oneil Dennis M | $166,285 |
Source: Public Records
Tax History Compared to Growth
Tax History
| Year | Tax Paid | Tax Assessment Tax Assessment Total Assessment is a certain percentage of the fair market value that is determined by local assessors to be the total taxable value of land and additions on the property. | Land | Improvement |
|---|---|---|---|---|
| 2025 | $8,511 | $622,600 | $234,800 | $387,800 |
| 2024 | $8,289 | $598,900 | $225,800 | $373,100 |
| 2023 | $8,121 | $562,000 | $225,800 | $336,200 |
| 2022 | $7,624 | $488,700 | $196,800 | $291,900 |
| 2021 | $7,250 | $441,300 | $189,100 | $252,200 |
| 2020 | $5,342 | $420,200 | $181,900 | $238,300 |
| 2019 | $9,567 | $404,000 | $173,800 | $230,200 |
| 2018 | $6,796 | $390,300 | $173,800 | $216,500 |
| 2017 | $6,811 | $372,200 | $165,800 | $206,400 |
| 2016 | $6,616 | $364,300 | $165,800 | $198,500 |
| 2015 | $6,232 | $350,900 | $157,500 | $193,400 |
| 2014 | $5,958 | $343,000 | $154,200 | $188,800 |
Source: Public Records
Map
Nearby Homes
- 587 Bridge St
- 51 Stonegate Dr
- 26 Meadowbrook Dr
- 71 Stonegate Dr
- 28 Brookbend Way E
- 1993 Washington St
- 182 Crystal Water Dr Unit 182
- 217 Crystal Water Dr
- 78 Crystal Water Dr
- 2045 Washington St
- 94 Pond St
- 1 Simmons Place
- 29 Hayes Rd
- 936 Central St
- 1247 Central St
- 455 Plymouth St
- 121 South St
- 23 Stone Meadow Dr
- 261 Plymouth St
- 22 Hudson St
- 43 Fieldcrest Dr
- 40 Fieldcrest Dr
- 42 Fieldcrest Dr
- 33 Fieldcrest Dr
- 38 Fieldcrest Dr
- 55 Fieldcrest Dr
- 50 Fieldcrest Dr
- 9 Fieldcrest Dr
- 31 Fieldcrest Dr
- 25 Fieldcrest Dr
- 11 Fieldcrest Dr
- 23 Fieldcrest Dr
- 3 Fieldcrest Dr
- 34 Fieldcrest Dr
- 36 Fieldcrest Dr
- 27 Fieldcrest Dr
- 27 Lot 27 Fieldcrest Dr
- 32 Fieldcrest Dr
- 17 Fieldcrest Dr
- 30 Fieldcrest Dr