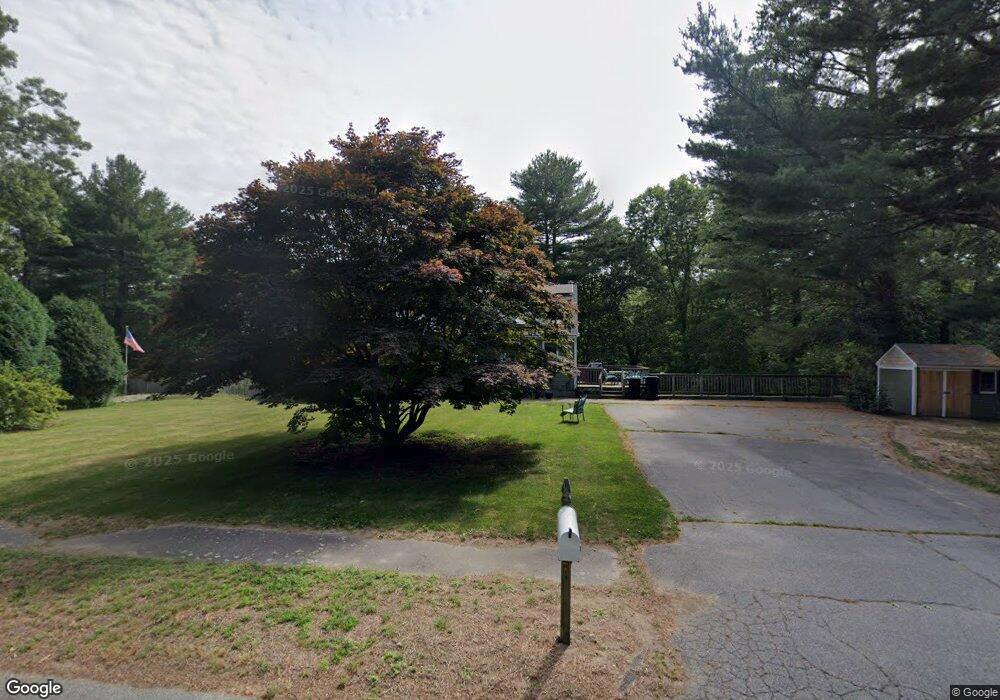
39 Firefly Rd Halifax, MA 02338
Estimated Value: $589,000 - $665,000
3
Beds
2
Baths
1,748
Sq Ft
$354/Sq Ft
Est. Value
About This Home
This home is located at 39 Firefly Rd, Halifax, MA 02338 and is currently estimated at $618,302, approximately $353 per square foot. 39 Firefly Rd is a home located in Plymouth County with nearby schools including Silver Lake Regional High School, Halifax Elementary School, and Silver Lake Regional Middle School.
Ownership History
Date
Name
Owned For
Owner Type
Purchase Details
Closed on
May 29, 1996
Sold by
Phu Jason and Lespasio-Phu Clair
Bought by
Welch Thomas B and Bruni Michelle M
Current Estimated Value
Purchase Details
Closed on
Oct 29, 1993
Sold by
S & S Rt
Bought by
Phu Jason V and Lespasio Phu Clair
Create a Home Valuation Report for This Property
The Home Valuation Report is an in-depth analysis detailing your home's value as well as a comparison with similar homes in the area
Home Values in the Area
Average Home Value in this Area
Purchase History
| Date | Buyer | Sale Price | Title Company |
|---|---|---|---|
| Welch Thomas B | $135,000 | -- | |
| Phu Jason V | $106,300 | -- |
Source: Public Records
Mortgage History
| Date | Status | Borrower | Loan Amount |
|---|---|---|---|
| Open | Phu Jason V | $100,000 | |
| Open | Phu Jason V | $169,800 |
Source: Public Records
Tax History
| Year | Tax Paid | Tax Assessment Tax Assessment Total Assessment is a certain percentage of the fair market value that is determined by local assessors to be the total taxable value of land and additions on the property. | Land | Improvement |
|---|---|---|---|---|
| 2025 | $6,373 | $446,600 | $191,400 | $255,200 |
| 2024 | $6,186 | $429,600 | $184,100 | $245,500 |
| 2023 | $6,003 | $403,400 | $178,700 | $224,700 |
| 2022 | $5,815 | $363,200 | $159,500 | $203,700 |
| 2021 | $5,671 | $326,100 | $153,400 | $172,700 |
| 2020 | $5,450 | $312,500 | $153,400 | $159,100 |
| 2019 | $5,339 | $305,600 | $148,900 | $156,700 |
| 2018 | $5,127 | $290,500 | $140,500 | $150,000 |
| 2017 | $5,170 | $279,000 | $140,500 | $138,500 |
| 2016 | $4,816 | $250,200 | $118,900 | $131,300 |
| 2015 | $4,782 | $251,800 | $118,900 | $132,900 |
Source: Public Records
Map
Nearby Homes
- 443 Thompson St
- 0 Morse St Unit 73387111
- 23 Tony Terrace
- 26 Old Summit St
- 780 Old Plymouth St
- 68 Walnut St
- 98 Walnut St
- 285 South St
- 250 East St
- 74 Magnolia Way
- 148 Lot 1a Elm St
- 8 Hilda Ln
- 1638 Plymouth St
- 1617 Plymouth St Unit 3
- 1617 Plymouth St
- 1397 Plymouth St Unit 1397
- 2 Country Club Dr
- 829 Auburn St
- 6 Amanda's Way Unit 6
- 24 High Pond Dr
- 49 Firefly Rd
- 29 Firefly Rd
- 59 Firefly Rd
- 19 Firefly Rd
- 38 Firefly Rd
- 50 Firefly Rd
- 20 Lillypond Ln
- 10 Lillypond Ln
- 9 Firefly Rd
- 386 Thompson St
- 378 Thompson St
- 384 Thompson St
- 358 Thompson St
- 30 Lillypond Ln
- 2 Lillypond Ln
- 15 Lillypond Ln
- 9 Lillypond Ln
- 396 Thompson St
- 352 Thompson St
- 25 Lillypond Ln
Your Personal Tour Guide
Ask me questions while you tour the home.