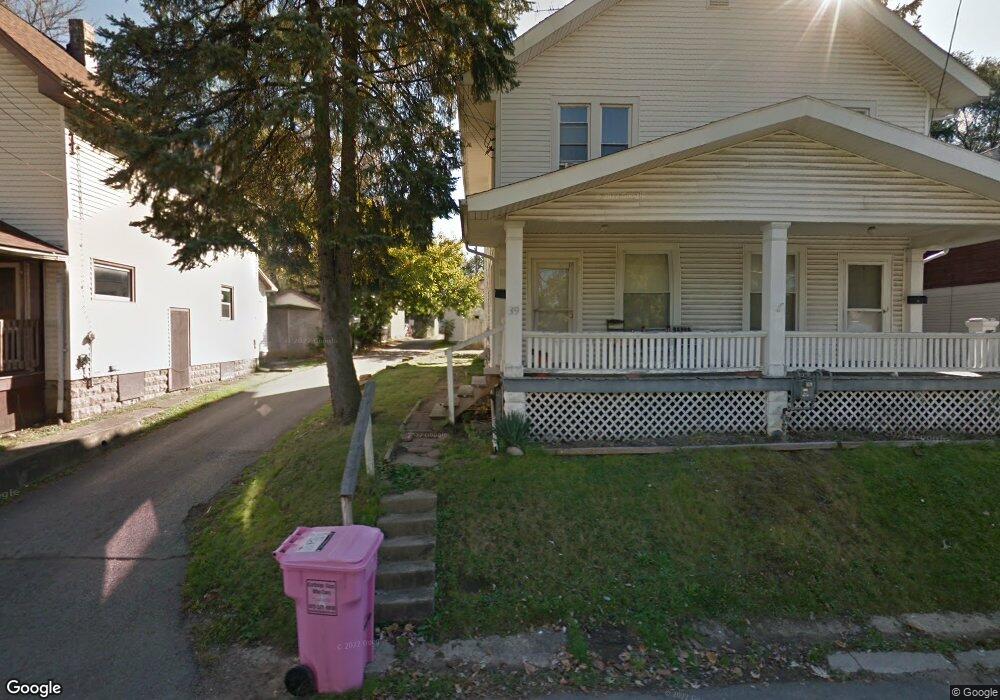
39 Florence Ave Unit 41 Mansfield, OH 44907
Estimated Value: $89,000 - $159,000
4
Beds
2
Baths
2,472
Sq Ft
$47/Sq Ft
Est. Value
About This Home
This home is located at 39 Florence Ave Unit 41, Mansfield, OH 44907 and is currently estimated at $115,034, approximately $46 per square foot. 39 Florence Ave Unit 41 is a home located in Richland County with nearby schools including St. Peter's Elementary/Montessori School, St. Peter's High School/Junior High, and Discovery School.
Ownership History
Date
Name
Owned For
Owner Type
Purchase Details
Closed on
Mar 16, 2023
Sold by
Davis Margaret
Bought by
5D Holdings Llc
Current Estimated Value
Home Financials for this Owner
Home Financials are based on the most recent Mortgage that was taken out on this home.
Original Mortgage
$77,000
Outstanding Balance
$74,578
Interest Rate
6.12%
Mortgage Type
New Conventional
Estimated Equity
$40,456
Purchase Details
Closed on
Jun 23, 2006
Sold by
Masters Mark E and Masters Jeannine K
Bought by
Davis Margaret
Home Financials for this Owner
Home Financials are based on the most recent Mortgage that was taken out on this home.
Original Mortgage
$39,600
Interest Rate
5.25%
Mortgage Type
Purchase Money Mortgage
Purchase Details
Closed on
Feb 17, 1994
Sold by
Waddell L Jack
Bought by
Masters Richard A
Purchase Details
Closed on
May 2, 1990
Create a Home Valuation Report for This Property
The Home Valuation Report is an in-depth analysis detailing your home's value as well as a comparison with similar homes in the area
Home Values in the Area
Average Home Value in this Area
Purchase History
| Date | Buyer | Sale Price | Title Company |
|---|---|---|---|
| 5D Holdings Llc | $38,850 | Stonegate Title | |
| 5D Holdings Llc | $38,850 | Stonegate Title | |
| Davis Margaret | $44,000 | Chicago Title | |
| Masters Richard A | $26,000 | -- | |
| -- | $20,000 | -- |
Source: Public Records
Mortgage History
| Date | Status | Borrower | Loan Amount |
|---|---|---|---|
| Open | 5D Holdings Llc | $77,000 | |
| Closed | 5D Holdings Llc | $77,000 | |
| Previous Owner | Davis Margaret | $39,600 |
Source: Public Records
Tax History Compared to Growth
Tax History
| Year | Tax Paid | Tax Assessment Tax Assessment Total Assessment is a certain percentage of the fair market value that is determined by local assessors to be the total taxable value of land and additions on the property. | Land | Improvement |
|---|---|---|---|---|
| 2024 | $1,047 | $22,360 | $2,460 | $19,900 |
| 2023 | $1,047 | $22,360 | $2,460 | $19,900 |
| 2022 | $684 | $12,240 | $2,020 | $10,220 |
| 2021 | $689 | $12,240 | $2,020 | $10,220 |
| 2020 | $704 | $12,240 | $2,020 | $10,220 |
| 2019 | $780 | $12,240 | $2,020 | $10,220 |
| 2018 | $770 | $12,240 | $2,020 | $10,220 |
| 2017 | $749 | $12,240 | $2,020 | $10,220 |
| 2016 | $832 | $13,190 | $2,330 | $10,860 |
| 2015 | $795 | $13,190 | $2,330 | $10,860 |
| 2014 | $785 | $13,190 | $2,330 | $10,860 |
| 2012 | $597 | $13,180 | $2,450 | $10,730 |
Source: Public Records
Map
Nearby Homes
- 137 Lexington Ave
- 286 S Main St
- 259 S Main St
- 172 -172 1 2 Lexington Ave
- 120 Grover St
- 394 S Main St
- 212 S Main St
- 327 Hammond Ave
- 96 Glenwood Heights
- 186 S Mulberry St
- 175 S Mulberry St
- 319 Altamont Ave
- 353 Sturges Ave
- 188 S Franklin Ave
- 0 Cline Ave Hedeen Abbeyfeale Unit 9066362
- 69 Reba Ave
- 257 Wood St
- 131 Sturges Ave
- 0 N Adams St
- 135 Wood St
- 47 Florence Ave
- 35 Florence Ave
- 49 Florence Ave
- 42 W Blanche St
- 89 Florence Ave
- 50 Florence Ave
- 31 Florence Ave
- 48 W Blanche St
- 36 W Blanche St
- 53 Florence Ave
- 32 Florence Ave
- 91 Lexington Ave
- 27 Florence Ave
- 89 Lexington Ave
- 28 W Blanche St
- 97 Lexington Ave
- 54 E Blanche St
- 26 W Blanche St
- 30 Florence Ave
- 109 Lexington Ave