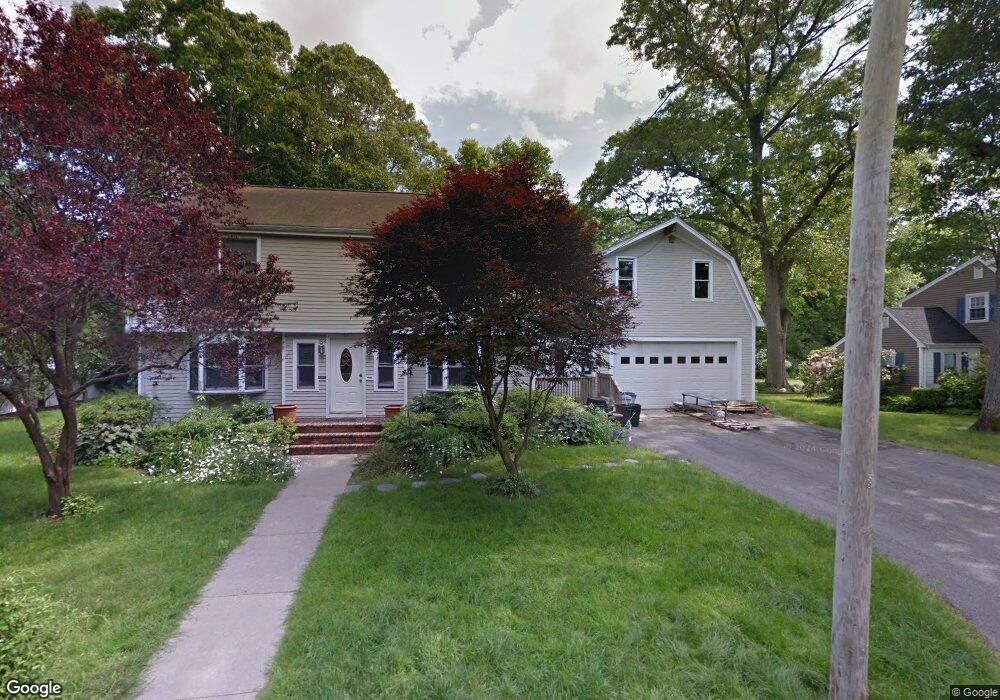
39 Florence St Rockland, MA 02370
Estimated Value: $604,000 - $714,111
4
Beds
3
Baths
2,350
Sq Ft
$284/Sq Ft
Est. Value
About This Home
This home is located at 39 Florence St, Rockland, MA 02370 and is currently estimated at $668,528, approximately $284 per square foot. 39 Florence St is a home located in Plymouth County with nearby schools including Rockland Senior High School, Calvary Chapel Academy, and Holy Family Elementary School.
Ownership History
Date
Name
Owned For
Owner Type
Purchase Details
Closed on
May 7, 2018
Sold by
Howes Thomas J and Scopelleti-Howes Mary P
Bought by
Scopelleti Mary P
Current Estimated Value
Purchase Details
Closed on
Apr 26, 2018
Sold by
Howes Thomas J and Scopelleti-Howes Mary P
Bought by
Scopelleti Mary P
Purchase Details
Closed on
Sep 23, 1986
Bought by
Howes Thomas J and Scopelleti Mary P
Create a Home Valuation Report for This Property
The Home Valuation Report is an in-depth analysis detailing your home's value as well as a comparison with similar homes in the area
Home Values in the Area
Average Home Value in this Area
Purchase History
| Date | Buyer | Sale Price | Title Company |
|---|---|---|---|
| Scopelleti Mary P | -- | -- | |
| Scopelleti Mary P | -- | -- | |
| Howes Thomas J | $130,000 | -- |
Source: Public Records
Mortgage History
| Date | Status | Borrower | Loan Amount |
|---|---|---|---|
| Previous Owner | Howes Thomas J | $100,000 |
Source: Public Records
Tax History
| Year | Tax Paid | Tax Assessment Tax Assessment Total Assessment is a certain percentage of the fair market value that is determined by local assessors to be the total taxable value of land and additions on the property. | Land | Improvement |
|---|---|---|---|---|
| 2025 | $9,785 | $715,800 | $230,100 | $485,700 |
| 2024 | $9,499 | $675,600 | $217,100 | $458,500 |
| 2023 | $9,519 | $625,400 | $199,200 | $426,200 |
| 2022 | $9,120 | $544,500 | $173,200 | $371,300 |
| 2021 | $8,643 | $500,200 | $157,400 | $342,800 |
| 2020 | $7,588 | $433,600 | $149,900 | $283,700 |
| 2019 | $7,471 | $416,900 | $142,800 | $274,100 |
| 2018 | $7,117 | $390,600 | $142,800 | $247,800 |
| 2017 | $6,862 | $371,300 | $142,800 | $228,500 |
| 2016 | $6,606 | $357,300 | $137,300 | $220,000 |
| 2015 | $6,251 | $328,500 | $128,400 | $200,100 |
| 2014 | $5,924 | $323,000 | $125,900 | $197,100 |
Source: Public Records
Map
Nearby Homes
- 11 Chestnut Cir
- 9 Chestnut Cir
- 17 Birch St Unit 135
- 6 Chestnut Cir
- 30 Leisurewoods Dr
- 1 Canterbury Ln
- 40 Fir Rd Unit 386
- 119 Grove St Unit 234
- 135 Grove St Unit 123
- 135 Grove St Unit 115
- 135 Grove St Unit 133
- 103 Grove St Unit 349
- 50 Linden Park
- 19 Dyer St Unit 19
- 225 W Water St
- 3 Hickory Cir
- 9 Juniper Cir
- 11 Hawthorne St
- 86 Leisurewoods Dr Unit 279
- 0 W Water St
- 24 Lancaster St
- 29 Florence St
- 317 North Ave
- 30 Florence St
- 329 North Ave
- 15 Florence St
- 311 North Ave Unit 2
- 311 North Ave
- 311 North Ave Unit 1
- 305 North Ave Unit 307
- 20 Florence St
- 21 Lancaster St
- 31 Lancaster St
- 341 North Ave
- 15 Lancaster St
- 39 Lancaster St
- 29 Berlin St
- 289 North Ave
- 10 Florence St
- 349 North Ave
Your Personal Tour Guide
Ask me questions while you tour the home.