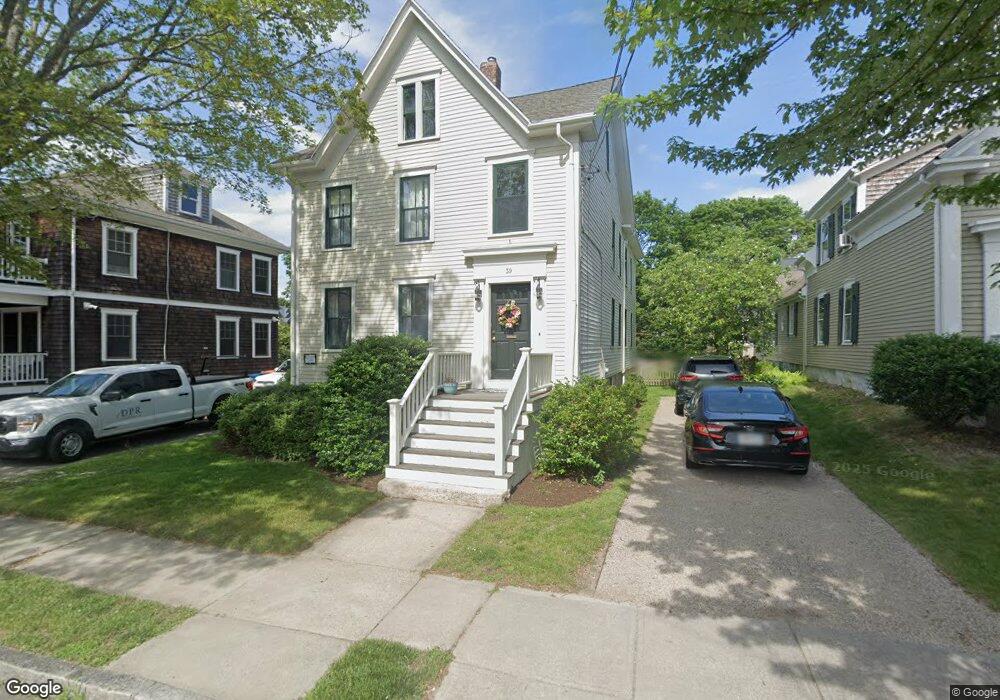
39 Fort St Unit 39 Fairhaven, MA 02719
Estimated Value: $726,000 - $871,000
2
Beds
1
Bath
1,344
Sq Ft
$576/Sq Ft
Est. Value
About This Home
This home is located at 39 Fort St Unit 39, Fairhaven, MA 02719 and is currently estimated at $774,204, approximately $576 per square foot. 39 Fort St Unit 39 is a home located in Bristol County with nearby schools including Fairhaven High School, City On A Hill Charter Public School New Bedford, and St. Joseph School.
Ownership History
Date
Name
Owned For
Owner Type
Purchase Details
Closed on
Jan 10, 2019
Sold by
Rasmussen Mark P
Bought by
Armstrong Jonathan N and Armstrong Michaela C
Current Estimated Value
Home Financials for this Owner
Home Financials are based on the most recent Mortgage that was taken out on this home.
Original Mortgage
$360,000
Outstanding Balance
$317,785
Interest Rate
4.8%
Mortgage Type
New Conventional
Estimated Equity
$456,419
Purchase Details
Closed on
May 2, 2005
Sold by
Rasmussen Mark P and Obrien-Rasmussen Maureen
Bought by
Rasmussen Mark P
Purchase Details
Closed on
Mar 1, 1999
Sold by
Fnma
Bought by
Rasmussen Mark P and Rasmussen Obrien-Rasmussen M
Purchase Details
Closed on
Sep 16, 1998
Sold by
Marcelino George
Bought by
Federal National Mortgage Association
Create a Home Valuation Report for This Property
The Home Valuation Report is an in-depth analysis detailing your home's value as well as a comparison with similar homes in the area
Home Values in the Area
Average Home Value in this Area
Purchase History
| Date | Buyer | Sale Price | Title Company |
|---|---|---|---|
| Armstrong Jonathan N | $450,000 | -- | |
| Rasmussen Mark P | -- | -- | |
| Rasmussen Mark P | -- | -- | |
| Rasmussen Mark P | $103,000 | -- | |
| Rasmussen Mark P | $103,000 | -- | |
| Federal National Mortgage Association | $112,695 | -- | |
| Federal National Mortgage Association | $112,695 | -- |
Source: Public Records
Mortgage History
| Date | Status | Borrower | Loan Amount |
|---|---|---|---|
| Open | Armstrong Jonathan N | $360,000 | |
| Previous Owner | Federal National Mortgage Association | $18,000 |
Source: Public Records
Tax History Compared to Growth
Tax History
| Year | Tax Paid | Tax Assessment Tax Assessment Total Assessment is a certain percentage of the fair market value that is determined by local assessors to be the total taxable value of land and additions on the property. | Land | Improvement |
|---|---|---|---|---|
| 2025 | $51 | $549,600 | $240,700 | $308,900 |
| 2024 | $5,014 | $543,200 | $240,700 | $302,500 |
| 2023 | $4,786 | $481,000 | $207,700 | $273,300 |
| 2022 | $4,530 | $443,200 | $189,200 | $254,000 |
| 2021 | $5,004 | $443,200 | $172,000 | $271,200 |
| 2020 | $4,697 | $424,700 | $172,000 | $252,700 |
| 2019 | $3,985 | $341,500 | $147,400 | $194,100 |
| 2018 | $3,751 | $321,500 | $140,200 | $181,300 |
| 2017 | $3,648 | $303,000 | $134,900 | $168,100 |
| 2016 | $3,373 | $276,900 | $132,300 | $144,600 |
| 2015 | $3,364 | $276,900 | $132,300 | $144,600 |
Source: Public Records
Map
Nearby Homes
- 32 Green St
- 70 Chestnut St
- 2 Washburn Ave
- 17 Middle St
- 121 Green St
- 17 Turner Ave
- 58 Washington St
- 0 Nulands Neck Unit 73286360
- 77 Main St
- 133 Pleasant St
- 3 Bridge St
- 77 Adams St
- 2 Bridge St
- 138 Main St Unit 5
- 230 Green St
- 3 Harbor Mist Dr
- 9 Abbott St
- 9 Cleveland St
- 15 Bayview Ave
- 0 Acushnet Ave Unit 73127174